


Sirona Technologies Carbon Capture 2025, 2 Projects, Cella
Sirona Technologies DAC Projects, 2 Major Deployments in Oman & Kenya, IMC…

Remora Carbon Capture 2025, $180 Credit & Union Pacific Pilot
Remora DAC Expansion, 3 Railroad Pilots with Norfolk Southern, 1 Shopify…

Noya Carbon Capture 2025, 1 CEC R&D Project
DAC Commercialization Risks, Noya's 60% VC Funding Drop, 1 CEC R&D Project, and…
Occidental Carbon Capture 2025, $137M CDR, Nasdaq Deal
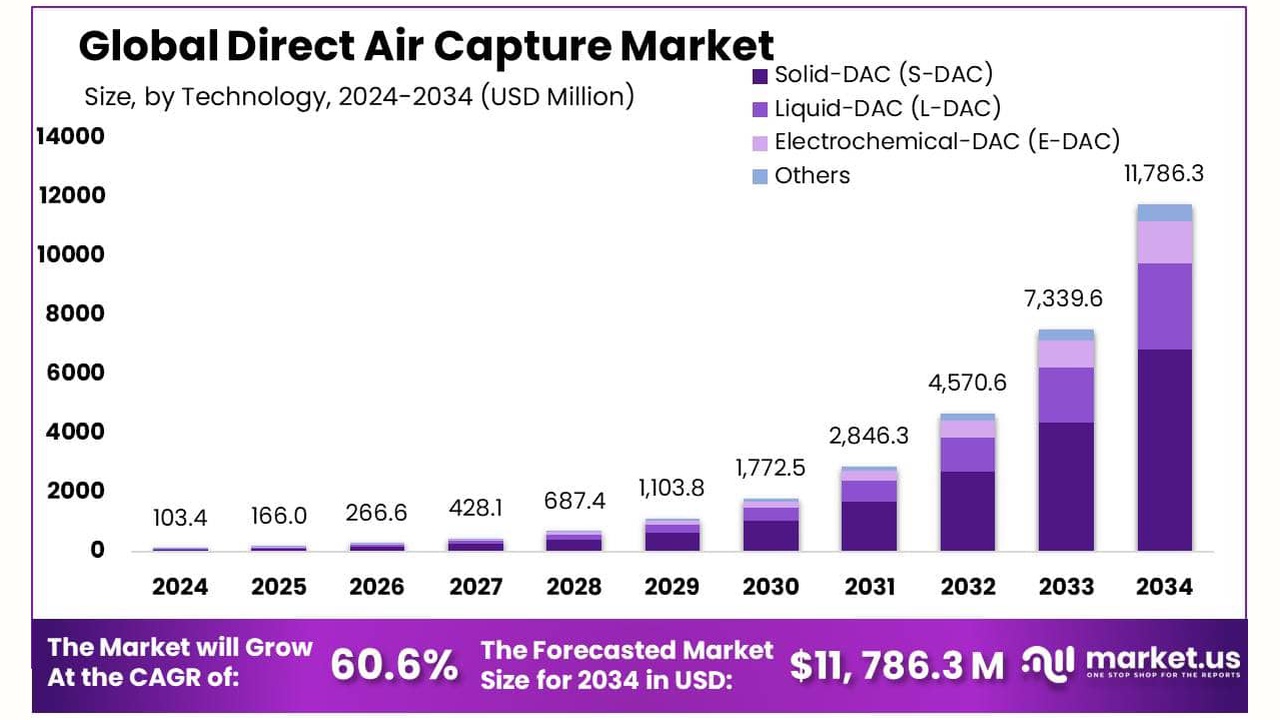
DAC Offtake Agreements, sub-$200 JPMorgan Deal, $2.58 B Market Forecast, and 5+…
Climeworks Carbon Capture 2025, 40k Tonne Morgan Stanley Deal
Climeworks DAC Offtakes, $162 M Fund, Schneider Electric Deal, and 5 Major…
Baker Hughes Hydrogen 2026, $4.1B BP Acquisition
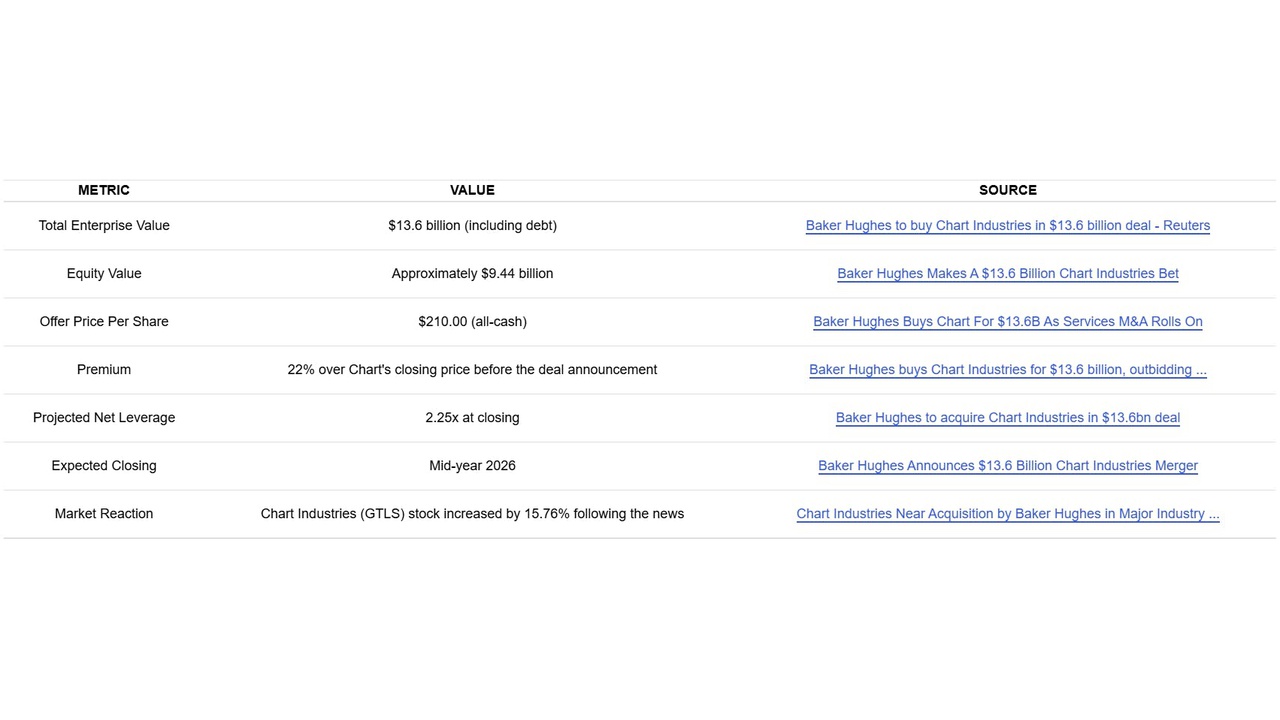
Baker Hughes Value Chain, $13.6 B Chart Deal, $22 B Project Cancellations, and…
Black Rock Carbon Capture 2025, $1.2B Eni Deal
Black Rock DAC Strategy, $550 M Occidental Investment, $38 B AES Talks, and 2…

Stripe Carbon Capture 2025, 6+ Projects w/ Alphabet
DAC Market Creation, Stripe's Frontier Commits $550 M, $41 M Reverion Deal, and…
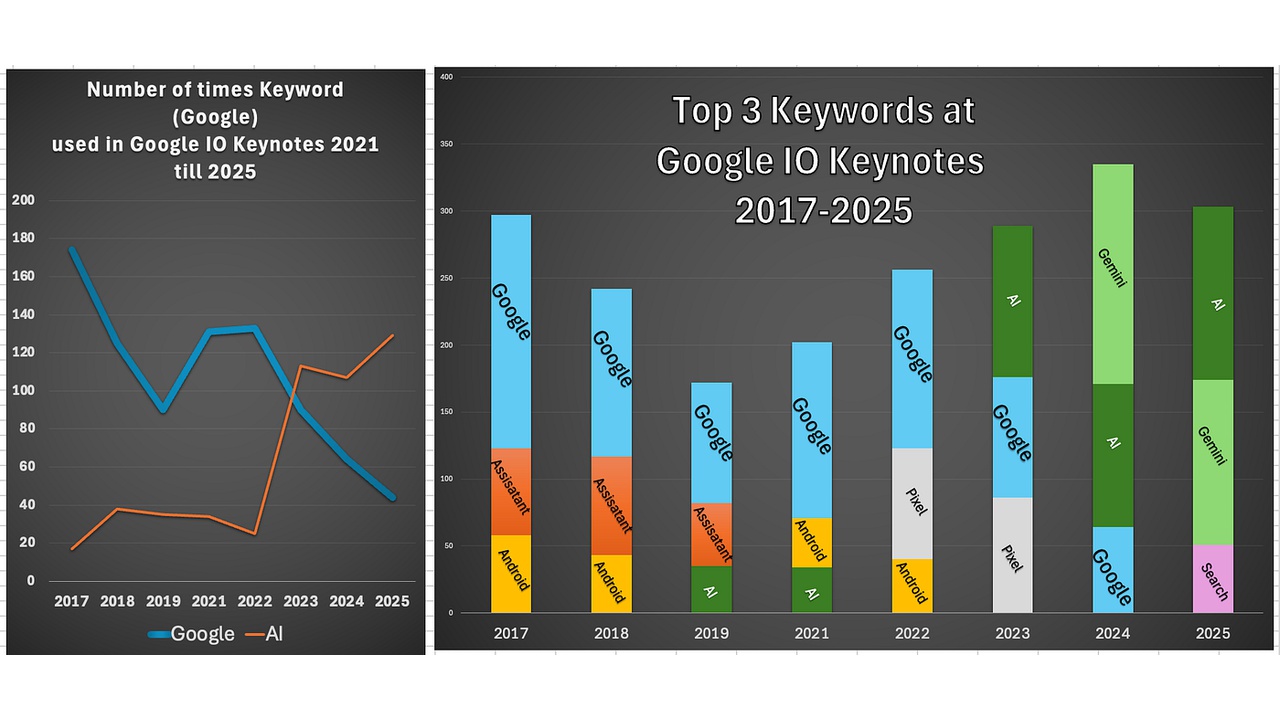
Google Carbon Capture 2025, €5.5B German Expansion
DAC AI-Driven Demand, Google's €5.5 B German Investment, $33 M Frontier…
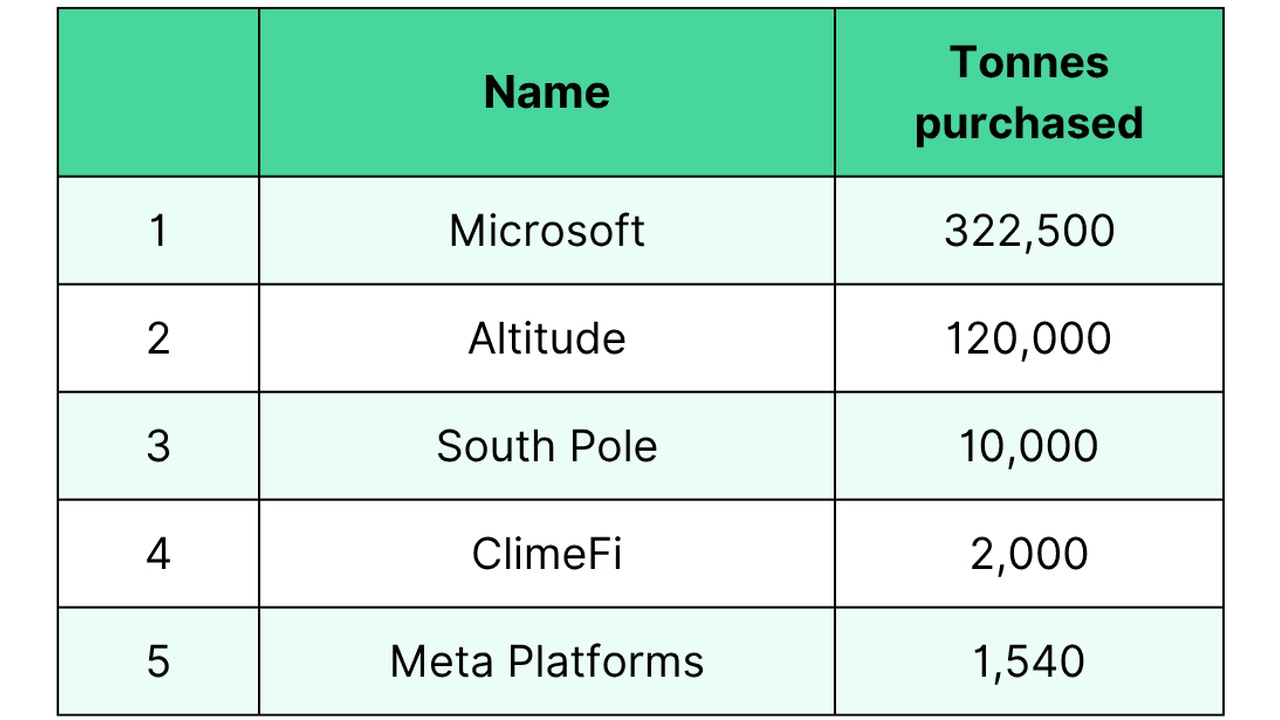
Meta Carbon Capture 2026, SAP's 37,000t Climeworks Deal
Meta DAC Inaction: Strategic Risk as Microsoft Signs 315, 000-Ton Heirloom Deal…