

Global Clean Energy Manufacturing 2026: Why US Policy is Splitting the Supply Chain from China
Clean Energy Manufacturing Shifts: How Policy Drives Commercial-Scale Projects in 2026
The global clean energy manufacturing market has fractured into two separate, policy-driven ecosystems, ending the era of a unified global supply chain. China maintains its structural dominance through immense state-backed scale, while the United States is deploying aggressive industrial policy, primarily the Inflation Reduction Act, to construct a parallel, high-resilience manufacturing base. This represents a fundamental shift from the 2021-2024 period, where market dynamics were primarily defined by China’s cost leadership and scale.
- During the 2021-2024 period, China solidified its position as the world’s primary clean energy factory, achieving market dominance through low-cost, high-volume production. By 2023, China controlled approximately 75% of global manufacturing capacity for clean energy technologies and refined critical inputs like 90% of the world’s rare earth metals.
- The period from 2025 to today is defined by the strategic response from the United States, which has pivoted from a market-led approach to state-led industrial policy. While China’s dominance in scaled manufacturing continues, with control over >80% of the global solar supply chain, the US Inflation Reduction Act (IRA) is now actively incentivizing the onshoring of production to build an independent, albeit higher-cost, supply chain.
- This bifurcation has created two distinct models for commercial adoption. China’s ecosystem provides the low-cost hardware essential for rapid, affordable decarbonization in developing nations. In contrast, the US and its allies are fostering a separate ecosystem that prioritizes supply chain security and geopolitical alignment, driving commercial-scale projects in North America and Europe that are insulated from dependence on China.
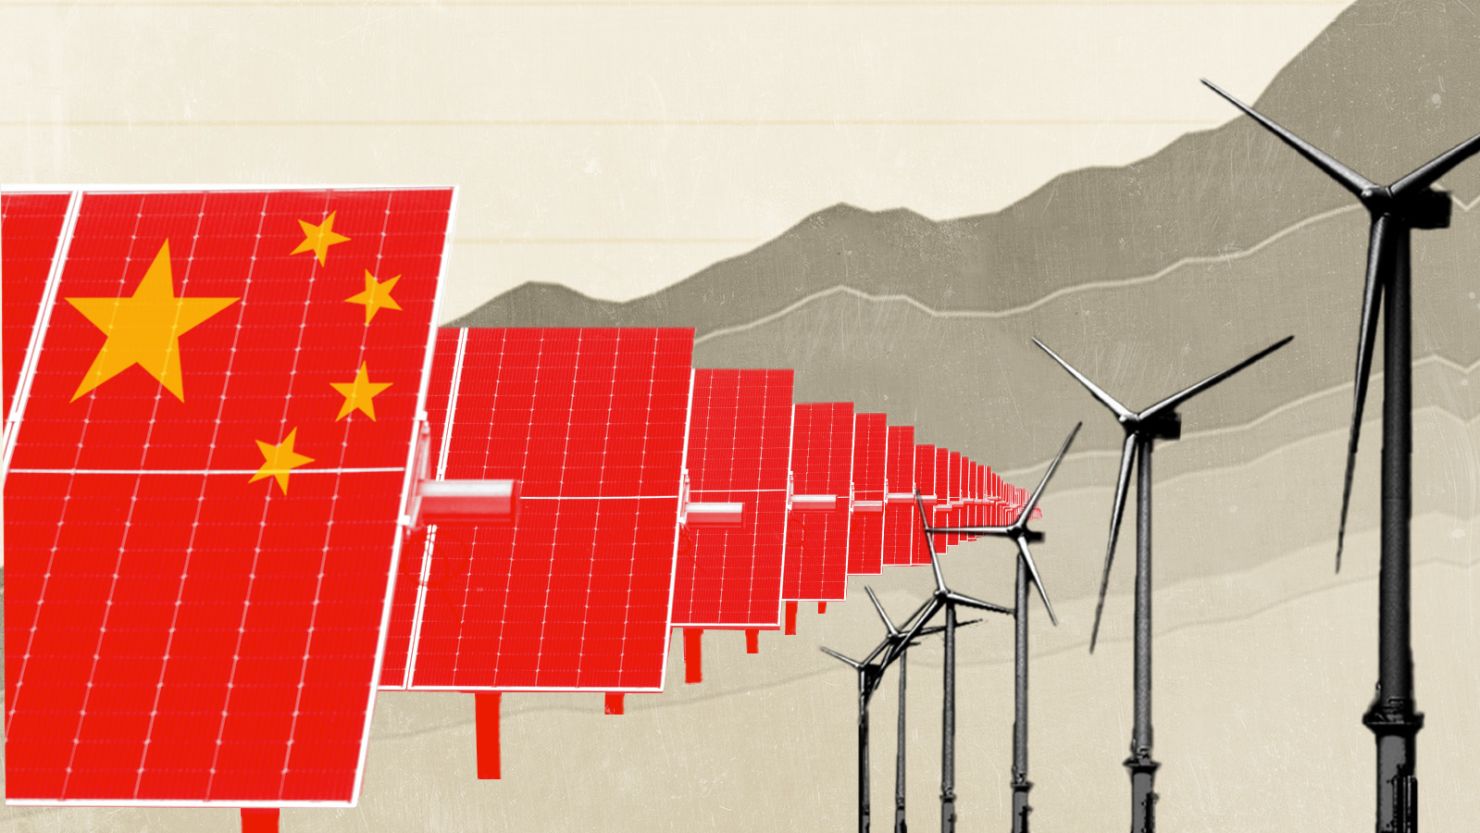
Visualizing China’s Clean Energy Scale
This image illustrates the immense manufacturing and deployment scale that underpins China’s structural dominance in the clean energy market, as described in the section.
(Source: CNN)
Clean Energy Investment Trends: Tracking Capital Flows in the US-China Policy Contest
Global clean energy investment is both accelerating and concentrating into two distinct spheres of influence, reflecting the deep geopolitical competition. China’s state-directed investment model continues to fund manufacturing and deployment at an unmatched scale, while US industrial policy has successfully catalyzed a surge of private capital dedicated to building a domestic, resilient supply chain.

China’s Clean Energy Investment Surges
This chart quantifies China’s massive capital flow into clean energy, with investment exceeding $196 billion in 2024, directly supporting the section’s analysis of investment trends.
(Source: LinkedIn)
- China’s investment remains the largest globally, accounting for 31% of all clean energy investment and contributing a record $2.1 trillion (11.4% of GDP) to its economy in 2025. This state-driven capital allocation reinforces its manufacturing dominance and economic growth.
- The United States’ strategy, anchored by the IRA, has successfully mobilized private capital for domestic manufacturing, even if total investment figures trail China’s. The rapid pace of new factory announcements for EVs, batteries, and solar components since late 2022 confirms that policy certainty is effectively de-risking private investment in onshoring efforts.
- Chinese firms are expanding their global footprint by investing approximately $80 billion in overseas clean technology projects in the year leading up to December 2025. This strategy creates new export markets for its products and further entrenches its role in global supply chains, particularly in developing economies.
Table: Key Financial and Policy Drivers in Clean Energy Investment
| Partner / Project | Time Frame | Details and Strategic Purpose | Source |
|---|---|---|---|
| China Economic Engine | 2025 | The clean energy sector contributed $2.1 trillion to China’s economy, driving over one-third of the country’s GDP growth. This validates the state’s strategy of using clean tech as a primary engine for economic expansion and global influence. | Eco-Business |
| US Industrial Policy (IRA) | 2025 – Present | The Inflation Reduction Act uses substantial subsidies and tax credits to incentivize onshoring of clean energy manufacturing. Its purpose is to build a parallel supply chain independent of China, framed as a national security imperative. | Stimson Center |
| China Overseas Investment | 2025 | Chinese firms drove approximately $80 billion into overseas clean technology projects. This investment creates new export markets for Chinese goods and secures its supply chain influence in regions outside the Western bloc. | ESG News |
| Global Investment Context | 2025 | China accounts for 31% of total global clean energy investment, which surpassed $3.3 trillion. This highlights China’s disproportionate role in financing the global energy transition infrastructure. | [PDF] Ember |
Geographic Divergence: How US and Chinese Clean Energy Leadership is Reshaping Global Markets
The geographic organization of clean energy manufacturing and deployment is splitting along geopolitical lines. China is consolidating its position as the industrial core for Asia, Africa, and Latin America, while the United States and its allies are creating a distinct economic bloc focused on domestic and “friend-shored” production in North America and Europe.

China Leads Global Capacity Growth
Accounting for 60% of new global renewable capacity in 2024, this chart powerfully illustrates the geographic leadership and market-reshaping role of China.
(Source: Statista)

Clean Energy Drives China’s GDP Growth
This chart validates the section’s key point that the clean energy sector has become a primary financial driver of China’s overall GDP growth.
(Source: Carbon Brief)
- Between 2021 and 2024, China’s geographic influence was primarily expressed through its role as the world’s factory and its enormous domestic deployment. In 2023 alone, China installed as much solar PV capacity as the entire world did in 2022, underscoring its central role in driving down global costs.
- From 2025 onward, this dynamic has evolved into active bloc formation. The US and its partners are formalizing their ecosystem through initiatives like the G 7 Clean Energy Economy Action Plan, which explicitly aims to build secure supply chains among allied nations as a direct counter to dependency on China.
- Simultaneously, China is securing its own sphere of influence by exporting capital and technology. Its $80 billion in recent overseas investments creates captive markets and reinforces its supply chain control in nations prioritizing low-cost development over geopolitical alignment with the West.
Technology Race: China’s Scale vs. US Next-Gen Focus in Clean Energy Competition
The technology rivalry is defined by strategic divergence, not direct competition on all fronts. China has achieved full-scale commercial maturity in existing technologies by perfecting process innovation and scale, whereas US policy is focused on creating a protected market to accelerate the development of next-generation, high-value technologies.

China’s Patent Activity Outpaces Rivals
This chart provides direct evidence for the “Technology Race,” showing China’s surging innovation activity as measured by high-quality patents compared to the US and other blocs.
(Source: Reddit)
- During the 2021-2024 period, China demonstrated its mastery of scaling mature technologies. By achieving over 85% of global solar cell production capacity, it successfully commoditized key components and drove down global costs, a core part of its industrial strategy.
- The period from 2025 to today shows a clear US response. Faced with China’s entrenched lead, which includes holding ~75% of global clean energy patent applications, the US is not trying to beat China on cost for existing technologies. Instead, the IRA and other policies are designed to foster domestic leadership in emerging fields like green hydrogen, advanced battery chemistries, and carbon capture.
- This creates a clear division in technology maturity. China leads in commercially scaled, cost-optimized technologies that are ready for mass global deployment. The US and its allies are cultivating an ecosystem to bring nascent, high-performance technologies from the pilot stage to commercial viability, accepting higher near-term costs in pursuit of future technological independence.
SWOT Analysis: Navigating the Bifurcated Clean Energy Supply Chain in 2026
The strategic clean energy landscape is now defined by the tension between China’s established manufacturing strengths and the US-led effort to build a resilient alternative. This dynamic has created a new set of opportunities and threats for investors and energy firms, who must now navigate two increasingly separate supply chain ecosystems.
- China’s primary strength remains its unmatched manufacturing scale and integrated supply chain, while its main weakness is its growing exposure to Western protectionist policies.
- The key strength for the US is its ability to direct massive private capital through policy, but its primary weakness is the higher cost and longer timeline required to build a domestic supply chain from a low base.
- Opportunities are emerging in next-generation US-based technologies and the development of “friend-shored” supply chains, while the overarching threat is the risk of global decarbonization slowing due to trade friction and duplicated, inefficient supply chains.
Table: SWOT Analysis for the Global Clean Energy Supply Chain
| SWOT Category | 2021 – 2024 | 2025 – 2026 | What Changed / Resolved / Validated |
|---|---|---|---|
| Strengths | China’s dominance in low-cost, high-volume manufacturing (e.g., ~75% global capacity in 2023) drove down global hardware prices. | The US Inflation Reduction Act (IRA) provides long-term policy certainty, successfully mobilizing private capital for domestic manufacturing projects. China’s manufacturing share remains high at ~70% of core technologies. | The US has validated that industrial policy can catalyze a domestic manufacturing resurgence, shifting its strength from market innovation to policy-driven industrial development. China’s strength in scale has been sustained. |
| Weaknesses | The US and Europe had a critical weakness: over-reliance on China for finished goods and processed materials (e.g., >80% of solar supply chain). | The US onshoring strategy creates higher-cost products, making its ecosystem less competitive on price. The cost to shift manufacturing away from China is estimated at $6 trillion. | The core weakness has shifted. For the US, it is no longer just dependency, but the high economic cost of resolving that dependency. For China, it is vulnerability to coordinated trade barriers. |
| Opportunities | The primary opportunity was leveraging China’s manufacturing scale to accelerate global decarbonization at the lowest possible cost. | A bifurcated market creates opportunities for leadership in two distinct areas: China in low-cost scale, and the US in secure, next-generation technologies and “friend-shored” supply chains with allies. | The opportunity is no longer singular. It has split into two tracks: participating in the China-led mass market or the US-led high-resilience, high-value market. |
| Threats | The main threat was the geopolitical risk of a single point of failure in the global supply chain, concentrated in China. | The primary threat is now active “green protectionism” and trade friction, which raises costs, creates inefficiencies, and risks slowing the overall pace of global decarbonization. | The threat has evolved from a passive risk (dependency) to an active conflict (trade war). This creates direct, near-term costs and market access challenges for global firms. |
2026 Forward Outlook: Navigating the Dual Clean Energy Ecosystems
If current policy trajectories hold, the global clean energy market will operate as two distinct ecosystems, forcing executives and investors to choose between China’s low-cost scale and the US-led bloc’s high-cost resilience. The most critical factor to watch is the political and economic willingness of Western governments and consumers to bear the higher costs associated with supply chain security.

China’s Projected Long-Term Energy Transition
This forward-looking chart visualizes the long-term energy transition plan for one of the world’s two clean energy ecosystems, perfectly matching the section’s outlook theme.
(Source: Elements by Visual Capitalist)

China Surpasses 2030 Renewable Target
This chart highlights a key strength from the SWOT analysis, demonstrating China’s ability to execute its large-scale energy goals six years ahead of schedule.
(Source: Energy Connects)
- If this happens: The US and EU continue to erect trade barriers against Chinese clean energy goods. Watch this: Retaliatory tariffs from China and the resulting impact on project costs and timelines for developers in Western markets. These policy actions will define the economic borders of the two ecosystems.
- If this happens: The cost gap between Chinese-made and Western-made components remains wide or grows. Watch this: The pace of final investment decisions for US-based manufacturing facilities. A slowdown could signal that subsidies are insufficient to overcome China’s structural cost advantages.
- This could be happening: Geopolitical alignment is becoming a key factor in energy infrastructure decisions. Signals to monitor include major renewable energy and grid contracts awarded in Southeast Asia, Africa, and Latin America, which will indicate whether a country is aligning with the China-centric or the US-centric ecosystem.
Frequently Asked Questions
Why is the global clean energy supply chain splitting into two?
The supply chain is splitting due to a fundamental shift in US policy. While China has long dominated with low-cost, high-volume manufacturing, the US Inflation Reduction Act (IRA) is now aggressively incentivizing the creation of a parallel, independent supply chain. This policy aims to reduce dependency on China for what is considered a national security imperative, creating two distinct ecosystems: one focused on China’s scale and the other on US-led supply chain resilience.
What is the main difference between the US and Chinese clean energy strategies?
China’s strategy relies on state-directed investment to achieve massive manufacturing scale in mature technologies (like solar panels), making it the low-cost provider for the world, especially developing nations. The US strategy, anchored by the IRA, uses subsidies to mobilize private capital for a domestic, higher-cost supply chain focused on security and fostering next-generation technologies like green hydrogen and advanced batteries.
Is US policy like the IRA actually working to build a domestic supply chain?
Yes, according to the analysis. The article states that the IRA’s policy certainty has successfully de-risked private investment and catalyzed a surge of new factory announcements for EVs, batteries, and solar components in the US since late 2022. It has validated that industrial policy can effectively mobilize private capital for onshoring efforts.
What is the biggest threat created by this supply chain split?
The primary threat is the rise of “green protectionism” and trade friction between the US-led bloc and China. This conflict creates duplicated, inefficient supply chains, raises overall costs for clean energy technologies, and risks slowing the global pace of decarbonization, which was previously benefiting from China’s low-cost hardware.
How are investment flows being affected by this geopolitical competition?
Investment is concentrating into two separate spheres. China remains the largest single investor, with its state-driven model pouring $2.1 trillion into its clean energy sector in 2025. Simultaneously, the US IRA is successfully mobilizing private capital for domestic manufacturing. Additionally, Chinese firms are investing heavily overseas (approx. $80 billion in 2025) to secure their influence in developing economies, creating distinct financial and supply chain blocs.