

Solar Growth Hotspots 2026: Mapping the New Regions Shaped by AI Demand and Policy Shifts
Solar Adoption Shifts from Policy to Industrial Demand at Commercial Scale
Solar project development is shifting from a primarily policy-driven model to one where massive industrial electricity demand, particularly from AI and data centers, is creating new, concentrated hotspots for commercial-scale deployment.
- From 2021 to 2024, solar adoption was largely propelled by broad government incentives and renewable portfolio standards, which resulted in geographically dispersed growth across established markets like the U.S. and Europe.
- In 2025-2026, a significant change occurred with the emergence of AI data centers as a primary demand catalyst, with one report noting their power needs are creating “solar hotspots” in states like Texas, which requires an additional 43 GW of power, and Virginia.
- This is confirmed by corporate actions like Microsoft‘s 12 GW solar panel supply agreement with Hanwha Qcells, a deal that directly links manufacturing expansion to corporate clean energy procurement for data center operations.
- Beyond data centers, new applications are gaining commercial traction. New Jersey’s 2025 agrivoltaics pilot program and California’s Project Nexus, a 5 MW solar-over-canal project, indicate that adoption is diversifying into dual-use land applications to maximize value.
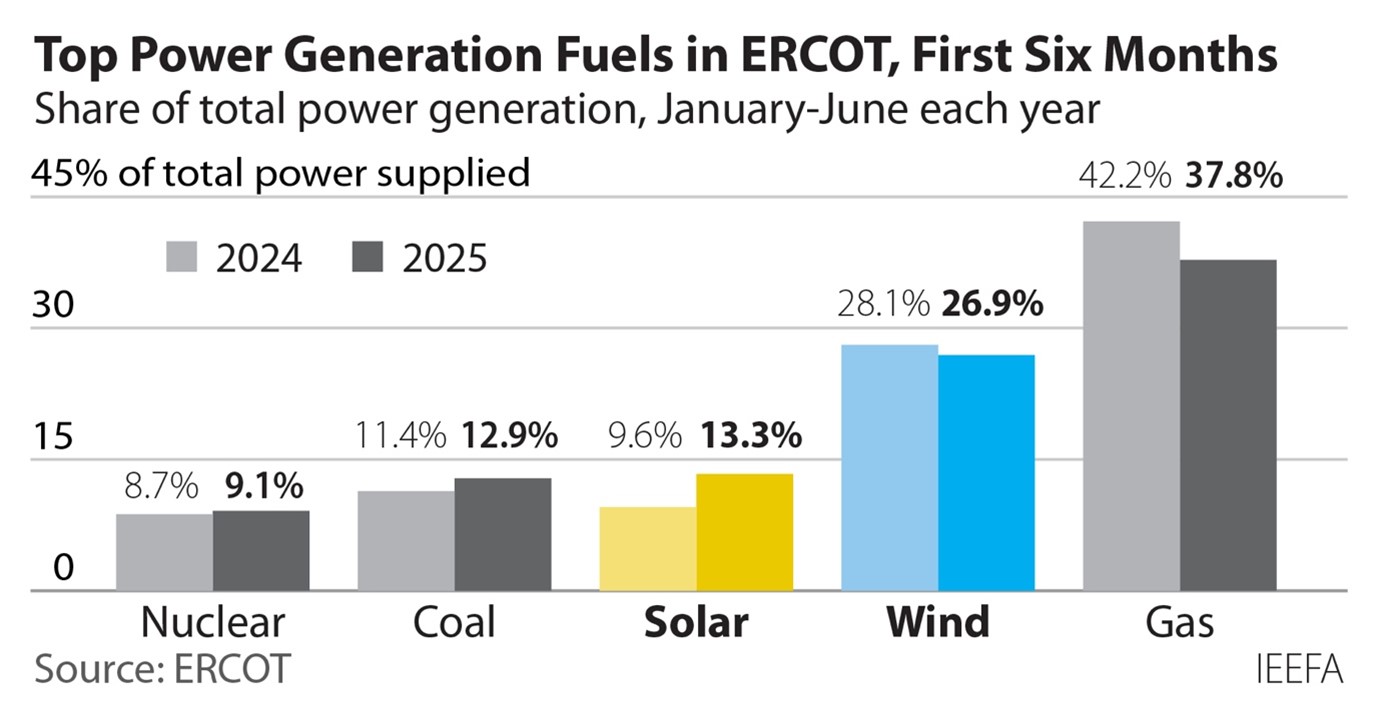
Solar Power Rises to Meet Texas Grid Demand
This chart shows solar’s growing share of the Texas grid, a key industrial and data center hub. This directly illustrates the article’s point about new, concentrated industrial demand driving solar adoption in specific hotspots.
(Source: IEEFA)
Solar Investment Analysis: Capital Flow Narrows to Vertically Integrated Hotspots
Solar investment strategy has matured from broad geographic diversification to targeted, high-value capital injections aimed at creating vertically integrated supply chains within politically stable and high-demand regions.
- Between 2021 and 2022, investments were characterized by broad market entry and expansion. Key examples include Hanwha‘s €727 million acquisition of RES France to secure a 5 GW European pipeline and a $150 million capital injection into its Australian retail energy business.
- A strategic pivot is evident in 2023-2025, highlighted by Hanwha Qcells’ massive $2.5 billion investment to build a complete domestic “Solar Hub” in Georgia, USA. This move was directly enabled by the financial incentives of the Inflation Reduction Act (IRA).
- This shift indicates capital is now following supportive industrial policy to build resilient, regional supply chains. The goal is to reduce exposure to the geopolitical and logistical risks associated with globally concentrated supply lines.
Table: Strategic Solar Investments (2021–2026)
| Partner / Project | Time Frame | Details and Strategic Purpose | Source |
|---|---|---|---|
| Hanwha Qcells Georgia Solar Hub | 2023–2025 | A $2.5 billion investment to create the first fully integrated solar supply chain in North America, from polysilicon to finished modules. The project aims to capitalize on U.S. industrial policy and secure domestic market share. | Canary Media |
| Hanwha Energy Australia | 2022 | A $150 million capital injection to expand its retail renewable energy business and project pipeline in Australia, targeting a mature market with strong solar resources. | Renew Economy |
| Acquisition of RES France | 2021 | Hanwha Solutions acquired the developer for €727 million to secure a 5 GW wind and solar project pipeline, accelerating its expansion across key European markets. | Hanwha Solutions |
Solar Partnership Strategy: Alliances Evolve for Supply Chain Control and Corporate Offtake
Strategic partnerships in the solar sector have evolved from simple joint development ventures to sophisticated alliances focused on securing domestic supply chains, guaranteeing large-scale corporate offtake, and integrating next-generation technologies.
- In 2021, partnerships were typified by traditional joint ventures for project development. A key example is the alliance between Hanwha‘s 174 Power Global and Total Energies to develop a 1.6 GW solar and storage portfolio across five U.S. states.
- From 2025 to 2026, partnerships demonstrate a strategic shift towards securing the entire value chain. This is seen in the Hanwha Renewables and Chrysalis Renewables deal to deploy a 3.5 GW pipeline, combining a developer with a long-term infrastructure asset owner.
- Corporate offtake became a central partnership driver, evidenced by the 2025 deal between Silfab Solar and Pivot Energy for 350 MW of U.S.-made modules and Mars & Cargill‘s agreement with Golden Peaks Capital for over 100 new solar projects in Europe.
- Future-facing alliances are also emerging, such as the 2026 Memorandum of Understanding between Lava Blue and Halo Cell Energy to establish an Australian supply chain for perovskite materials, signaling preparation for the next wave of solar technology.
Table: Key Solar Partnerships and Alliances (2021–2026)
| Partner / Project | Time Frame | Details and Strategic Purpose | Source |
|---|---|---|---|
| Hanwha Renewables & Chrysalis Renewables | Feb 2026 | A strategic partnership to develop and deploy an initial 3.5 GW portfolio of solar and BESS projects in North America, pairing a developer with a long-term infrastructure investor. | Solar Quarter |
| Lava Blue & Halo Cell Energy | Jan 2026 | An Mo U to establish a supply chain for high-purity perovskite precursor materials in Australia, a foundational step toward commercializing next-generation solar technology. | PV-Tech |
| Hanwha Qcells & Microsoft | Jan 2024 | An 8-year strategic alliance for Hanwha Qcells to supply 12 GW of U.S.-made solar modules and EPC services, directly fueling Microsoft‘s corporate clean energy goals. | Utility Dive |
| 174 Power Global (Hanwha) & Total Energies | Jan 2021 | A 50/50 joint venture to develop 12 utility-scale solar and storage projects totaling 1.6 GW across Texas, Nevada, Oregon, Wyoming, and Virginia. | Total Energies |
Global Solar Growth Hotspots: How New Demand is Redrawing the Map
While North America, Europe, and Asia remain the core solar markets, the next frontier of growth hotspots is now defined by three distinct drivers: policy-backed domestic manufacturing in the U.S., massive import-driven electrification in Africa, and state-funded industrial energy autonomy in the Middle East and India.

China Leads Global Solar Capacity Expansion
By comparing installed capacity across key regions like China, the EU, and the USA, this chart visualizes the global growth hotspots discussed in the section. It highlights Asia’s recent dominance, which helps redraw the global map.
(Source: Rejobs)
- Between 2021-2024, growth was concentrated in established markets with strong policy support, such as the U.S. and Europe. During this period, companies like Hanwha expanded through strategic acquisitions and the launch of new development entities like Q ENERGY.
- From 2025 onwards, specific regions within the U.S., like Georgia and Ohio, have become secondary hotspots beyond the established leader, Texas. This growth is driven by a favorable business climate and major investments like Hanwha’s $2.5 billion ‘Solar Hub’.
- Africa has emerged as a major import-driven demand center. The continent’s solar imports from China surged 60% in 2025 to reach a record 15 GW, signaling a massive and rapidly growing market for electrification projects.
- National industrial policy is creating concentrated pockets of extreme growth. This is exemplified by Saudi Arabia’s recent execution of power purchase agreements for 12, 000 MW of solar capacity and India’s boom in captive solar projects for industrial self-reliance in states like Punjab and Gujarat.
Solar Technology Maturity: Silicon PV Reaches Commercial Scale, Focus Shifts to Efficiency and New Applications
Standard silicon PV technology is fully mature and at commercial scale (TRL 9), with the market’s focus shifting from basic deployment to incremental efficiency gains, performance optimization for specific environments, and paving the commercial path for next-generation cells like perovskites.

Solar to Dominate Future Renewable Growth
This forecast shows solar surpassing other renewables to become the dominant source of new capacity. This illustrates the market outcome of silicon PV reaching full technological maturity, a central theme of the section.
(Source: Global X ETFs)
- In the 2021-2024 period, the primary technological driver was the scaling of mature silicon PV manufacturing to meet growing global demand fueled by supportive policies and falling costs.
- By 2025-2026, the innovation frontier moved towards maximizing output from deployed assets. Panel conversion efficiencies now commonly exceed 20%, with AIKO setting a new commercial module benchmark of 24.8% in December 2025.
- Technology is now being tailored for emerging hotspots. JA Solar‘s Desert Blue modules, which demonstrated a 4.98% higher power generation in desert trials, directly improve project economics in arid regions like the Middle East and North Africa.
- While silicon PV dominates, the industry is actively preparing for the future. Partnerships like the one between Lava Blue and Halo Cell Energy in 2026 to build a perovskite precursor supply chain signal that foundational work for the next technology wave is underway.
SWOT Analysis: Key Strengths and Risks Defining Solar Market Expansion
The solar market’s primary strength lies in its improving economics and strong policy support, creating immense opportunities in new industrial applications. However, this growth is constrained by grid limitations and significant policy risk, particularly in North America.

Solar Growth Tracks Toward Global Policy Goals
This chart illustrates the market’s strong growth, a key strength from the SWOT analysis. It also contextualizes this growth against policy ambitions like the COP28 goal, reinforcing the section’s points on policy support and market opportunity.
(Source: Hanwha Group)
Table: SWOT Analysis for Emerging Solar Growth Hotspots
| SWOT Category | 2021 – 2024 | 2025 – Today | What Changed / Validated |
|---|---|---|---|
| Strengths | Falling LCOE and established supply chains in Asia drove global adoption. Policy support like the IRA began to reshape investment decisions. | Panel efficiencies exceeding 20% are now standard, with benchmarks reaching 24.8%. A U.S. domestic supply chain is being built by players like Hanwha Qcells. | The thesis that policy incentives can successfully reshore manufacturing and create competitive domestic supply chains is being validated by the $2.5 billion Georgia ‘Solar Hub’ investment. |
| Weaknesses | Heavy reliance on Chinese supply chains for wafers, cells, and polysilicon. Grid interconnection queues were already becoming a bottleneck. | Grid congestion is leading to significant curtailment, with Texas’s ERCOT grid losing 1.2 GW per hour at times. Permitting delays remain a major hurdle, affecting even large developers like Hanwha. | The scale of new solar deployment has validated that existing grid infrastructure is a primary constraint on growth, shifting the focus from generation to transmission and storage. |
| Opportunities | Growth focused on utility-scale and residential markets in developed countries. Early integration with BESS was underway. | Explosive demand from AI data centers (e.g., Microsoft‘s 12 GW deal). New applications like agrivoltaics and solar-over-canals are being piloted. Massive import-driven demand in Africa. | The market has expanded beyond traditional electricity demand. AI has become a new, multi-gigawatt demand driver, creating an entirely new customer segment for large-scale solar. |
| Threats | Geopolitical tensions and trade disputes with China posed risks to the supply chain. Interest rate sensitivity was a known risk. | Policy instability is a clear and present danger, proven by the 99% investment collapse in Alberta. A potential change in U.S. administration threatens IRA incentives and permitting priority. | The Alberta example provided a real-world validation of how quickly political risk can destroy a market, making policy stability the single most critical factor for investors. |
Forward Outlook: Grid Infrastructure is the Critical Bottleneck for Solar Growth
The central challenge for the solar sector is whether grid modernization and permitting reform can keep pace with surging industrial demand from AI and electrification; if these bottlenecks are resolved, growth will accelerate beyond current forecasts.

Explosive US Solar Growth Strains Infrastructure
The dramatic projected increase in US solar capacity directly illustrates the scale of growth that creates the grid infrastructure bottlenecks discussed in this section. This surge in deployment represents the central challenge for the forward outlook.
(Source: Oklahoma Farm Report)
- If demand from AI data centers continues to accelerate as projected, then watch for an increase in large-scale solar-plus-storage Power Purchase Agreements that are co-located near new data center clusters, particularly in the U.S. Southeast and Texas.
- The 99% collapse in renewable investment in Alberta following a government policy pause serves as a critical warning. If similar policy instability emerges in the U.S. post-election, then watch for a potential freeze in capital deployment and project financing.
- Grid congestion is a proven risk, with Texas’s ERCOT grid seeing curtailment of 1.2 GW per hour during volatile periods. Watch for accelerated investment in BESS and grid-enhancing technologies as a direct response, validating the integrated solar-and-storage strategy of the Hanwha-Chrysalis partnership.
Frequently Asked Questions
What is the biggest change driving solar power growth now compared to a few years ago?
The primary driver for solar growth is shifting from broad government policies to massive, concentrated electricity demand from industrial users. A key example is the explosive growth of AI data centers, which are creating new “solar hotspots” in regions like Texas and Virginia. This industrial demand is now a primary catalyst for large-scale solar projects, moving beyond general renewable energy targets.
Why are companies like Hanwha Qcells investing billions in one specific place like Georgia, USA?
This reflects a strategic shift in investment from broad geographic expansion to creating vertically integrated supply chains in politically stable, high-demand regions. The $2.5 billion investment in the Georgia “Solar Hub” is a direct response to the U.S. Inflation Reduction Act (IRA). The goal is to build a complete domestic supply chain—from raw materials to finished modules—to reduce dependence on global supply lines and capitalize on supportive industrial policy.
What are the biggest risks or challenges facing the solar industry’s growth?
According to the analysis, the two biggest challenges are grid infrastructure and policy instability. Grid congestion is already a major problem, with grids like Texas’s ERCOT having to curtail, or waste, significant amounts of solar power because they can’t handle it. The second major risk is policy uncertainty, as demonstrated by the 99% collapse in renewable investment in Alberta after a sudden policy change, which makes political stability a critical factor for investors.
Are there new solar technologies on the horizon, or is everything focused on standard silicon panels?
While standard silicon PV technology is mature and dominates the market, the industry is preparing for the next wave of technology. Innovation is currently focused on increasing silicon panel efficiency (with benchmarks reaching 24.8%) and optimizing them for specific environments. However, strategic partnerships, like the one between Lava Blue and Halo Cell Energy to create a supply chain for perovskite materials, signal that foundational work for commercializing next-generation solar cells is actively underway.
Which new regions are emerging as solar growth hotspots and why?
New hotspots are emerging for different reasons. In the U.S., states like Georgia and Ohio are becoming hotspots due to supportive policy and major investments in domestic manufacturing. Africa has emerged as a major import-driven demand center, with imports surging 60% in 2025 for widespread electrification. Finally, regions like the Middle East (e.g., Saudi Arabia) and India are creating concentrated growth through national industrial policies aimed at energy autonomy for their industries.