T 1 Energy AI & Data Center Energy 2026, 50 MW Allocation

T 1 Energy Data Center Project, 50 MW Allocation from Statnett, 290 MW Open AI…


Thea Energy Fusion 2026, $2.64B Sector Funding

Stellarator Fusion Manufacturing, Thea Energy $100 M Series B, DOE Milestone…


Infographic showing China's 2025 renewable hydrogen targets: a bar chart with National Plan (~0.2) and Sum of regional targets (~1.1) on the left, an arrow to a pie chart on the right breaking down regional shares by province with Inner Mongolia largest (0.48) and smaller slices for Jilin, Guangdong, Qinghai, Ningxia, Hebei, Gansu, etc., plus a source line at the bottom.

Petro China Hydrogen 2025, 136% Output, SINOPEC

Green Hydrogen in China, Petro China's 8, 100 Ton Capacity, 221 B Yuan National…


SOFC market size bar chart showing USD 2.04B in 2025, USD 2.89B in 2026, and USD 16.53B in 2031 with 41.73% CAGR; dotted baseline indicates progression.

Bloom Energy Fuel Cell 2026, $5B Brookfield Deal

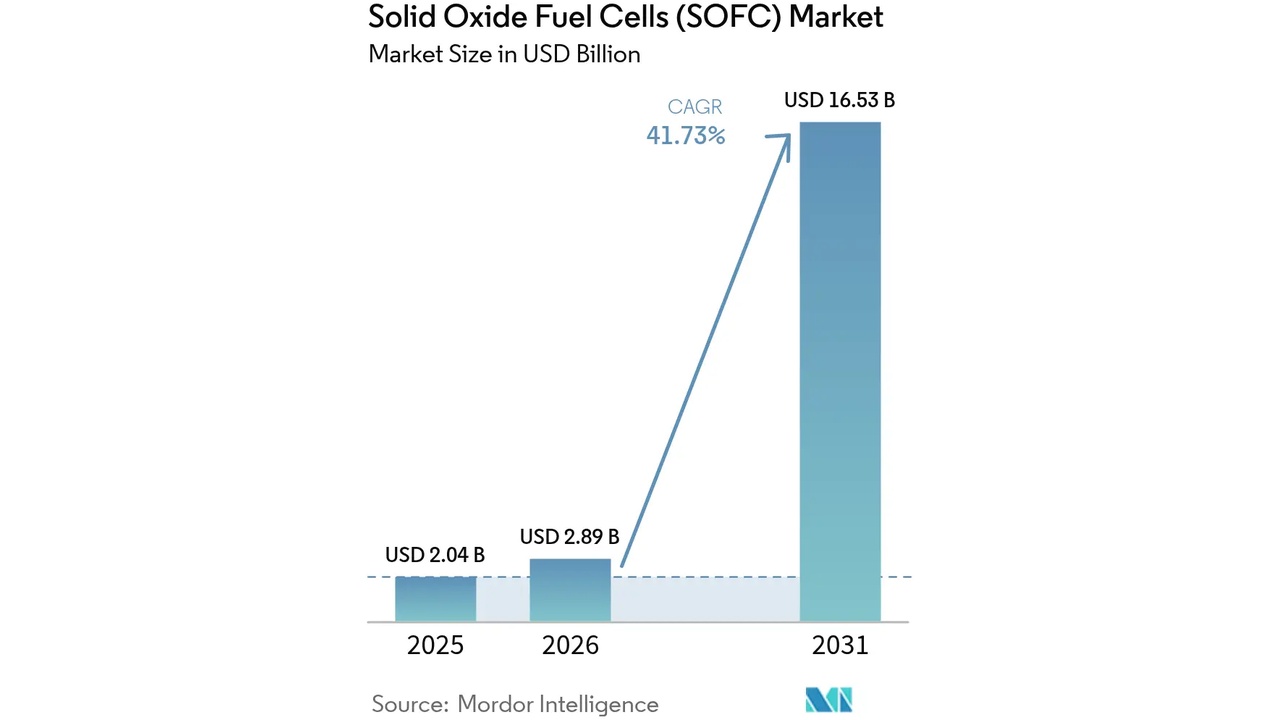
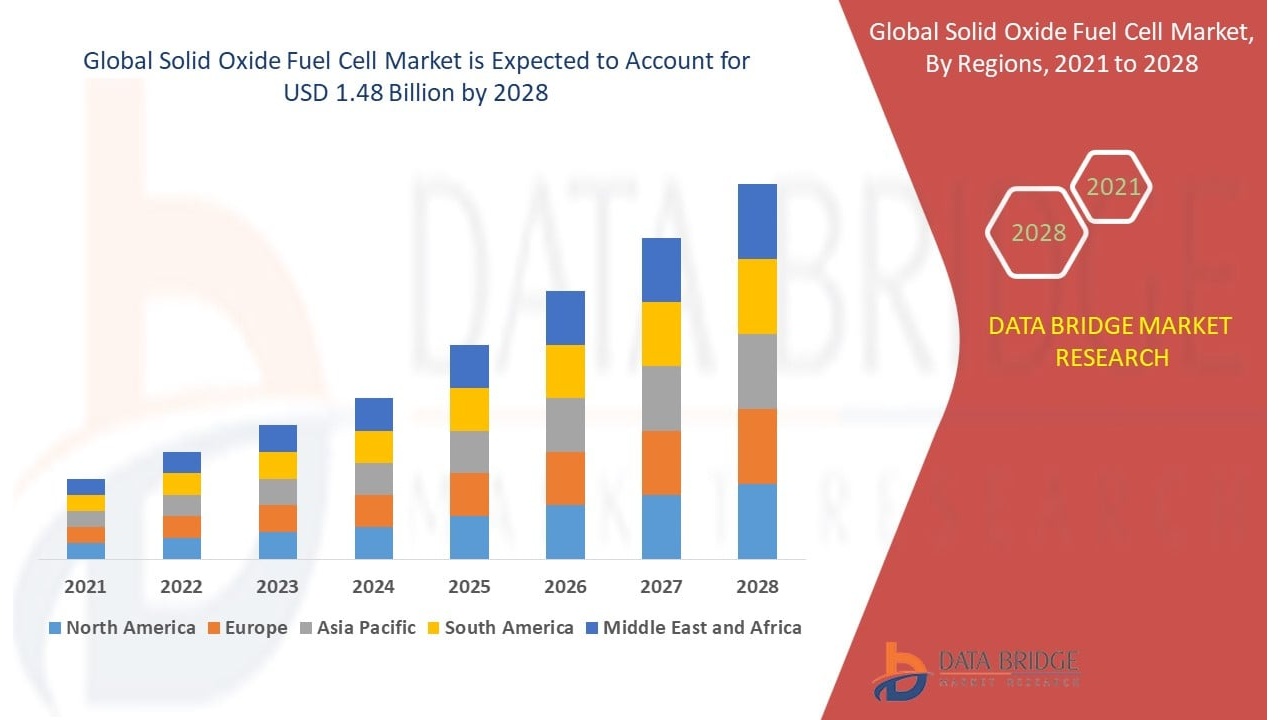
Solid Oxide Fuel Cells Industry Analysis 2026: Top Companies, Market Trends &…


Yearly stacked bar chart (2020–2030) of renewable generation by source: Solar PV, Wind, Hydro, Solar+Storage, Geothermal, with a right Y axis showing percent share and a line trend around 20% by 2030.

ENOC Distributed Energy 2025, $10.36B TAQA Challenge

ENOC Distributed Energy Strategy, 1 ADNOC-TAQA JV Response, $54.42 B Smart Grid…


Four-panel chart comparing climate/health benefit to cost ratio by technology (Solar, Wind, Grid DAC, Islanded DAC) across 2020–2050 for four scenarios (Stagnation, Efficiency, Advanced, Breakthrough).

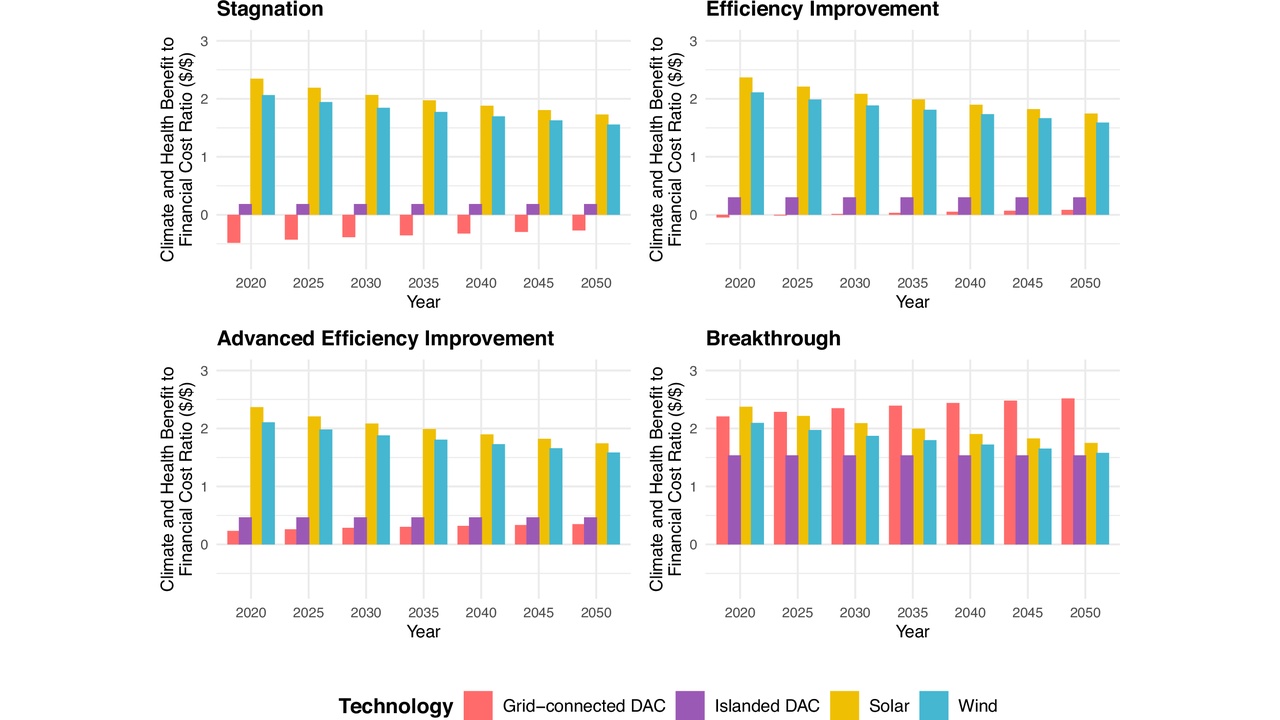
BP Carbon Capture 2025, Contrasts $500M ADNOC JV

BP DAC Strategy, $5 B Spending Cut vs Occidental's $1.3 B Stratos Project (2024…


Table listing five companies and their purchased tonnes: Microsoft 322,500; Altitude 120,000; South Pole 10,000; ClimeFi 2,000; Meta Platforms 1,540.

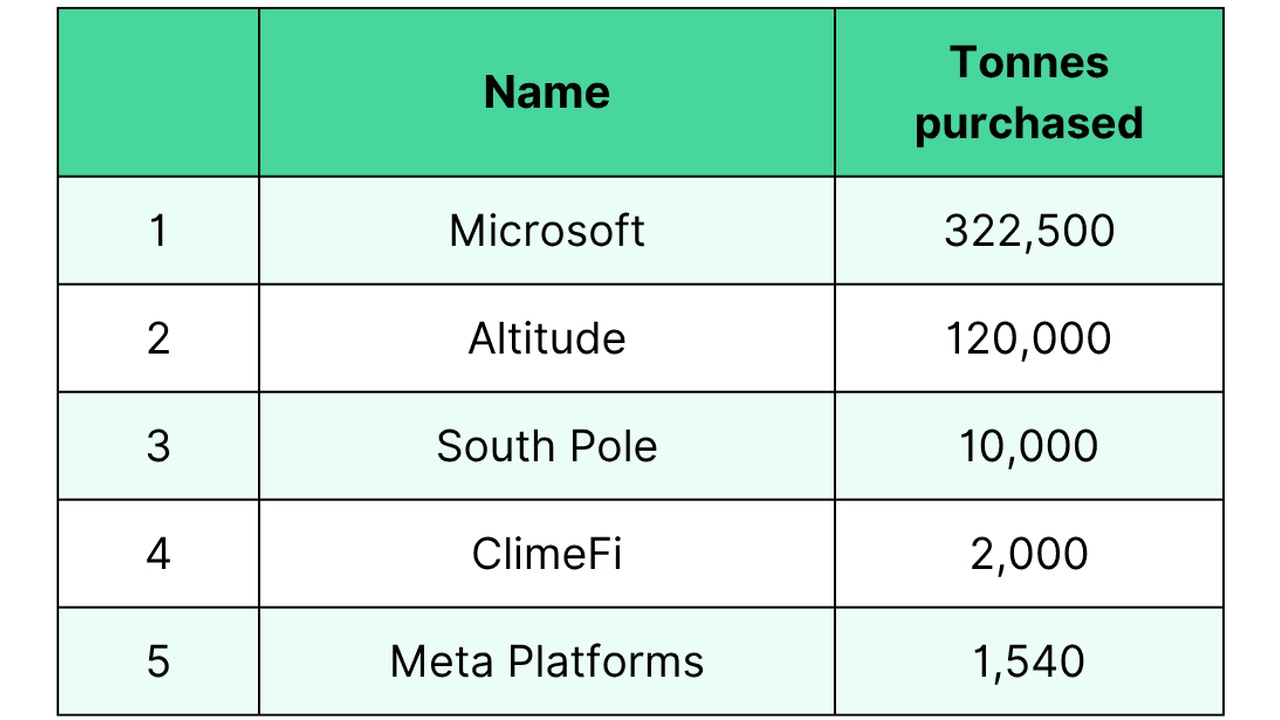
Meta Carbon Capture 2026, SAP's 37,000t Climeworks Deal

Meta DAC Inaction: Strategic Risk as Microsoft Signs 315, 000-Ton Heirloom Deal…


Stacked bar chart forecasting global solid oxide fuel cell market by region from 2021 to 2028, with regions color-coded as North America (blue), Europe (orange), Asia Pacific (gray), South America (yellow), and Middle East & Africa (light blue).

SOFC Market Analysis 2026: Bloom & Ceres Target Data Centers

Solid Oxide Fuel Cells Market Leaders 2026: Powering AI & Data Centers Industry…


Infographic on carbon capture and sequestration market, featuring a blue left panel, a rising line chart, a world map, and global market size and segmentation sections.

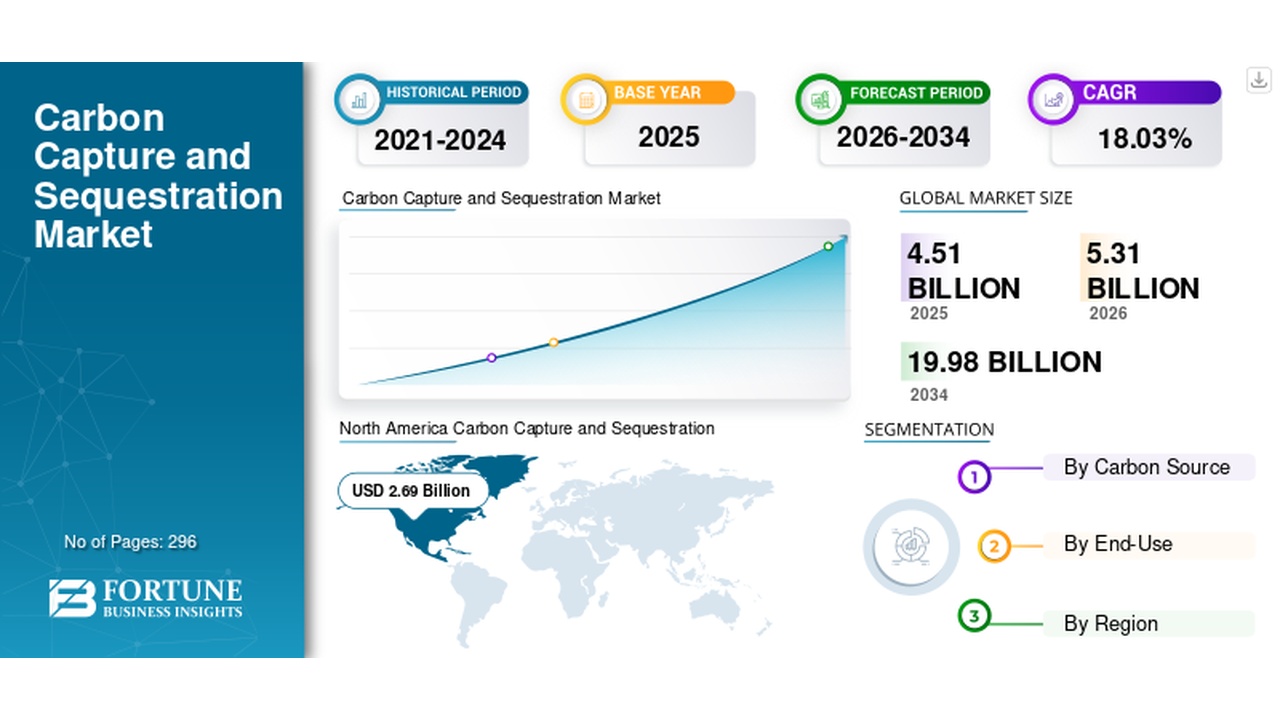
Avnos Carbon Capture 2026, $17M Shell Project

Carbon Capture Market Report 2026: Analysis of Top Companies & Key Trends…


Bar chart of 2025 investment in clean energy tech; Solar PV leads by far, followed by wind, storage, biomass, geothermal, electrolyzer, and CCUS.

Fervo Energy Geothermal 2026, 10.5 GW Microsoft Deal

Enhanced Geothermal Drilling, Fervo Energy gets $44 million DOE support for…


Privacy Preference Center