


OpenAI AI & Data Center Energy 2026, $300B Oracle Deal
AI Compute Financing, $35 B Apollo Deal for Anthropic, 3.5 GW Target, and $500…
Oracle AI Data Centers 2026, $638B RPO, Blackstone Deal
Oracle Data Center Expansion, $70 B Cap Ex Plan, $40 B Nvidia Deal, and Open AI…
Fuel Cell Energy Fuel Cell 2026, 4 GW SDCL Pipeline
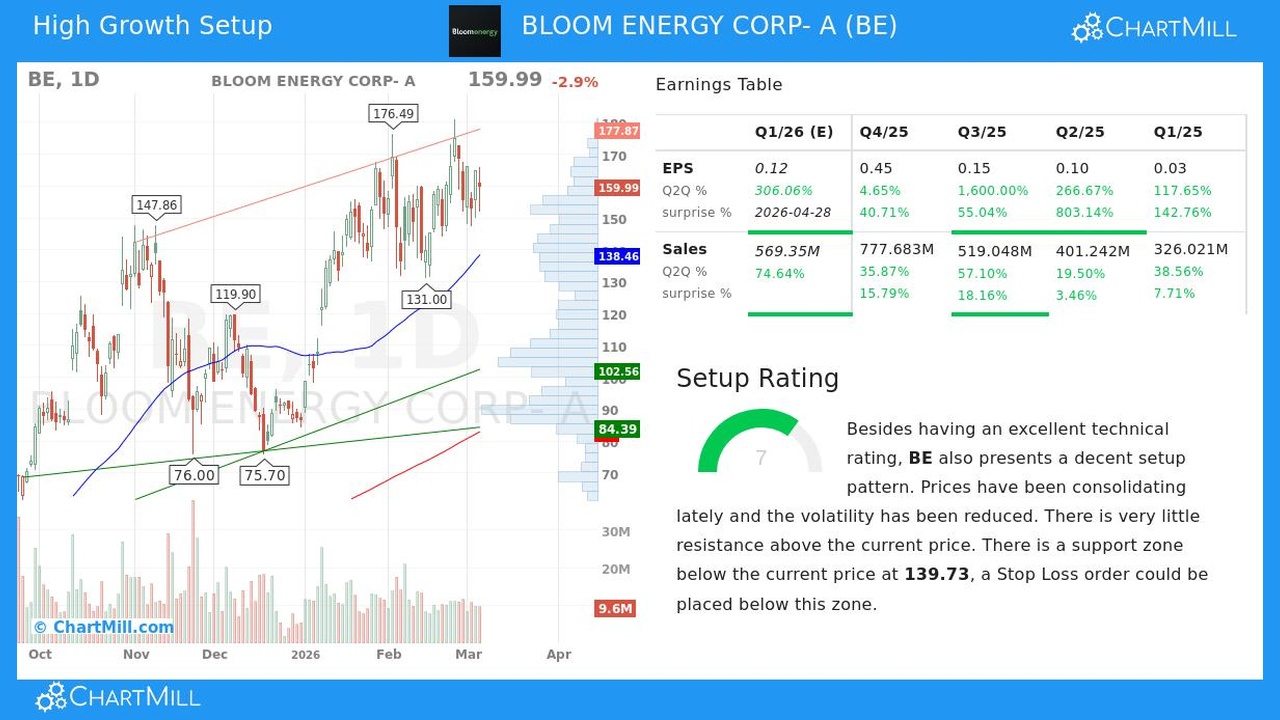
SOFC Data Center Projects, Bloom Energy 900 MW Wyoming Deal, 1 GW AEP Order,…

Bloom Energy Fuel Cell 2026, 100 MW Equinix Deal
Bloom Energy SOFC Data Center Deals, $5 B Brookfield Partnership and 2.8 GW…
Bloom Energy Fuel Cell 2026, $2.6B European AI Deal
SOFC Data Center Power, Bloom Energy's $2.6 B AEP Deal, 2.8 GW Oracle…

Fuel Cell Energy Fuel Cell 2026, $2.6B Nebius Deal
Fuel Cell Energy MCFC Pivot, 4 GW Data Center Pipeline and $35.6 M Q 2 Revenue…

Bloom Energy Fuel Cell 2026, 1 GW AEP Deal
Top 10 SOFC Data Center Players: Bloom's 2.8 GW Oracle Deal, 9 New Agreements,…
Oracle Natural Gas 2025, 2,300 MW Volta Grid Fleet
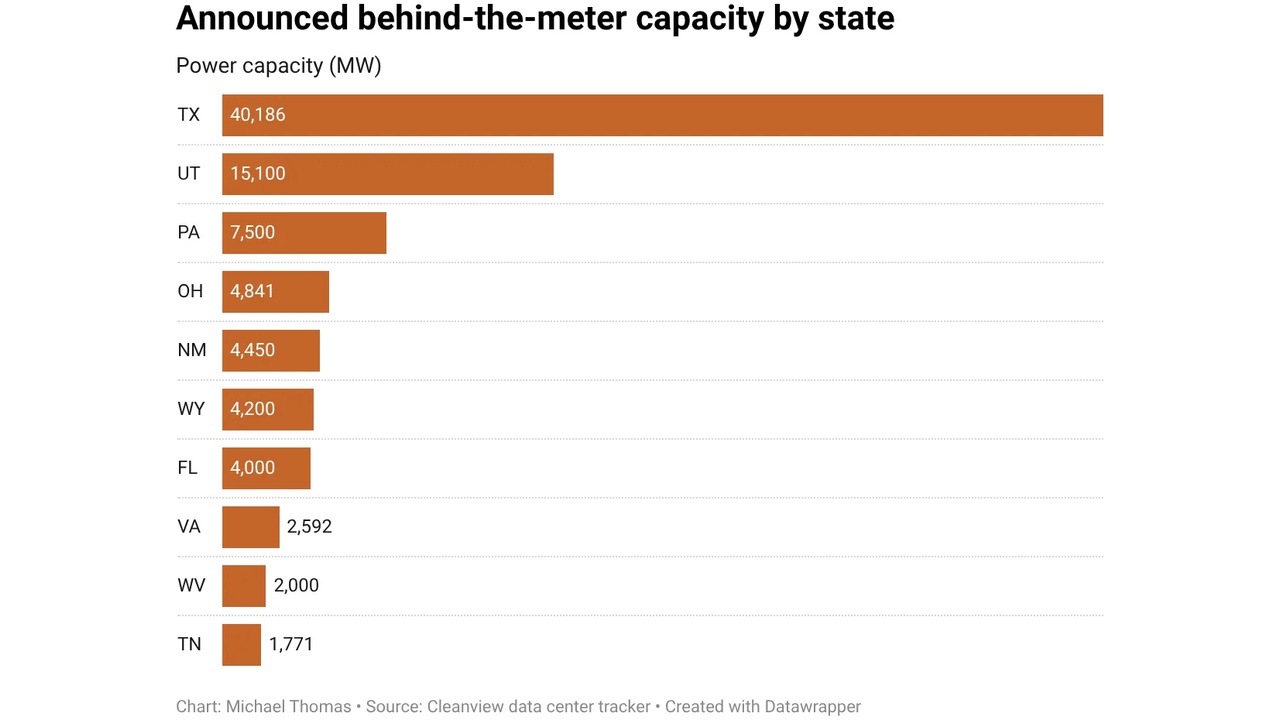
Top 10 Behind-the-Meter Power Projects: Fermi America's 11, 000 MW Plan and 48…

Bloom Energy Fuel Cell 2026, 2 GW Fremont Expansion
Bloom Energy SOFC Expansion, $2.65 B AEP Offtake, 2.8 GW Oracle Deal, and Major…
Bloom Energy Fuel Cell 2026, 2.8 GW Oracle Agreement
Bloom Energy 2026: Fueling the AI Revolution with Landmark Data Center Deals……