Composite infographic with four line charts showing tanker freight rates: Middle East to China, Singapore to China, Nigeria to the Netherlands, and US Gulf to the Netherlands, highlighting a spike in 2026 amid Iran strikes.

Toyota Hydrogen 2026, 70% Gas Price Surge Spurs cellcentric

Green Hydrogen Market Acceleration, Toyota cellcentric Partnership, €1 B Moeve…


Stacked bar chart showing Global Fuel Cell Market size (USD billions) by year from 2023 to 2033, rising from 6.8 to 70.2 total, with segments by fuel cell type (Proton Exchange Membrane, Solid Oxide, Phosphoric Acid, Alkaline, Microbial, Others). Key yearly totals labeled above each bar.

Bloom Energy Fuel Cell 2026, $5B Brookfield Deal

SOFC Data Center Deals: Bloom Energy's $5 B Brookfield Pact and 1 GW AEP…


Schematic of a molten carbonate fuel cell system with a gas turbine on the left and an HRSG on the right, showing CO2 outputs and a temperature range of 550–650°C (informative diagram).

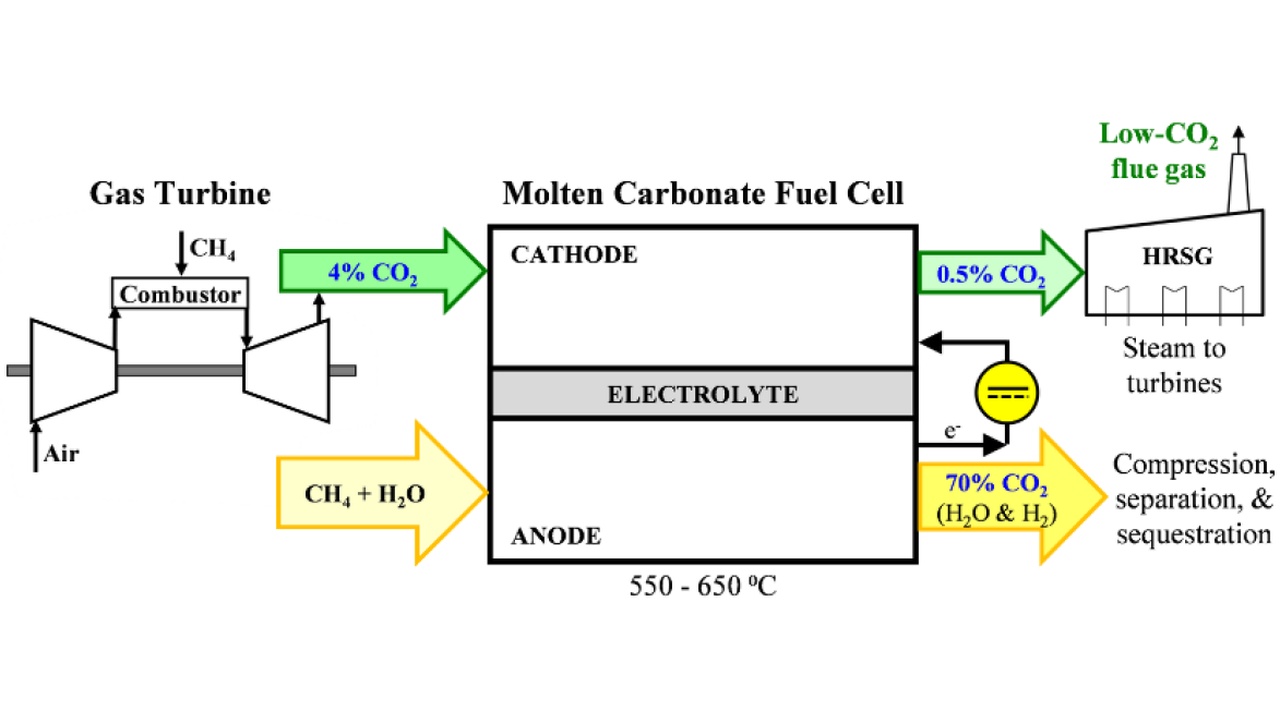
Fuel Cell Energy Fuel Cell 2026, $1.17B Backlog, Exxon Mobil

Fuel Cell Energy MCFC Strategy, 450 MW SDCL Deal, Exxon Mobil Pilot, and 1.5 GW…


Bar chart showing projected phosphoric acid fuel cell market size by application from 2020 to 2030, with Cogeneration (light blue), Vehicles (purple), and Others (darker purple); right panel notes 20.9% CAGR 2024-2030 and Grand View Research source.

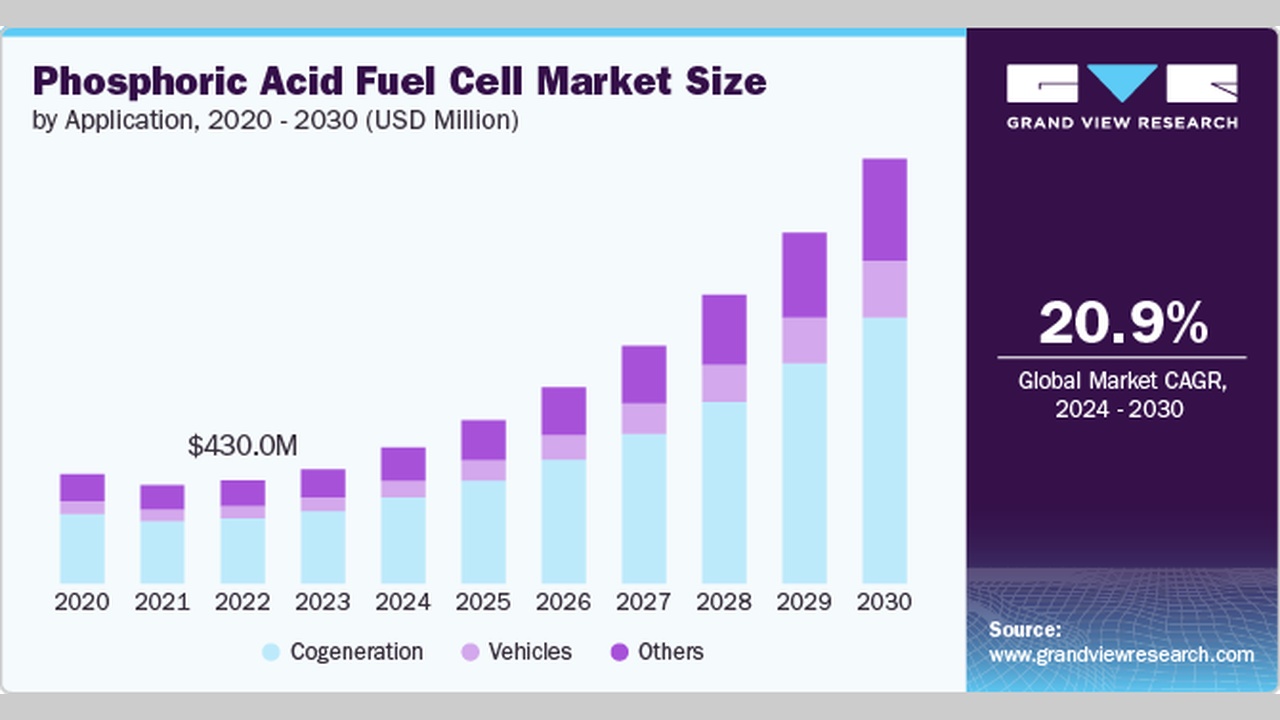
Doosan Fuel Cell Fuel Cell 2026, 1 LG Electronics MOU

Doosan Fuel Cell PAFC Niche, 460 k W Pure Cell System, 1 LG Electronics MOU,…


Bar chart titled Hydrogen Electrolyzer Market showing projected CAGR 2026–2036 by country: US ~21%, UK ~20.4%, Germany ~16.2%, with Future Market Insights branding on the right pane.

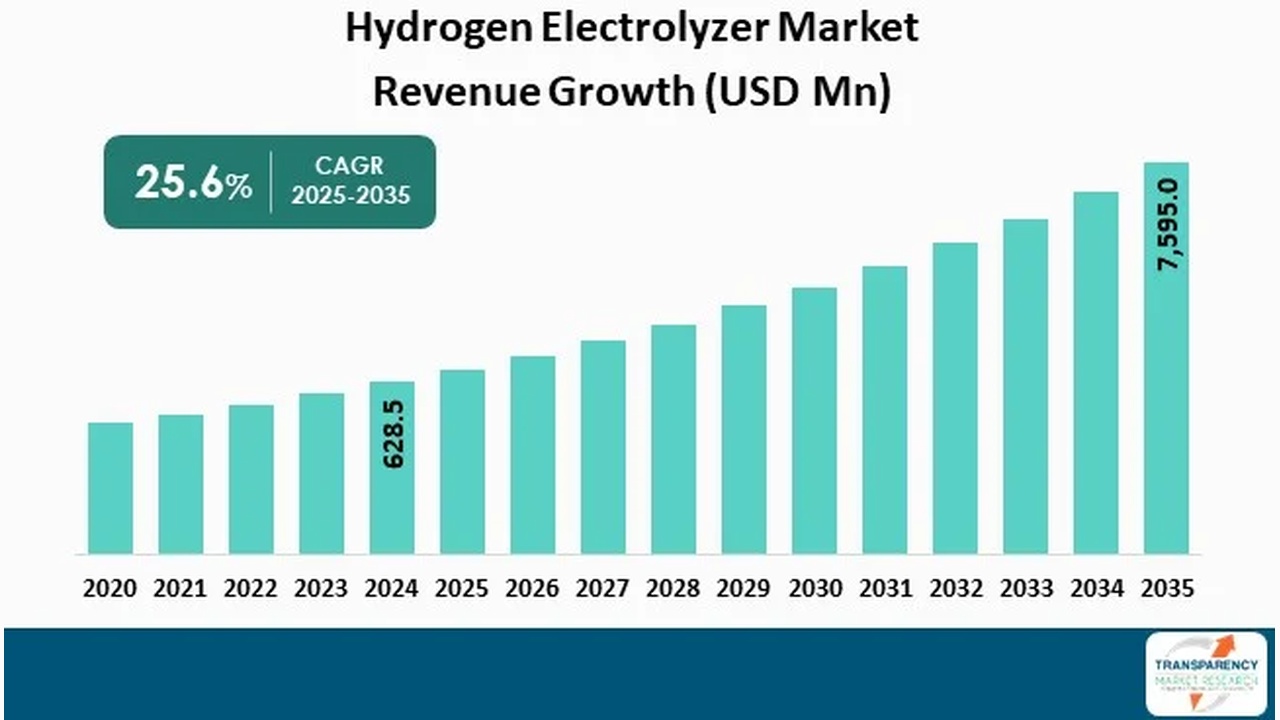
Sunfire Hydrogen 2026, 200 MW Repsol Deal

Alkaline Electrolysis Costs, €215 M Sunfire Round, 20% Chinese Price Edge, and…


Bar chart showing hydrogen electrolyzer market revenue from 2020 to 2035, rising from ~2020 levels to 7,595.0 USD Mn in 2035 with a 25.6% CAGR (2025–2035).

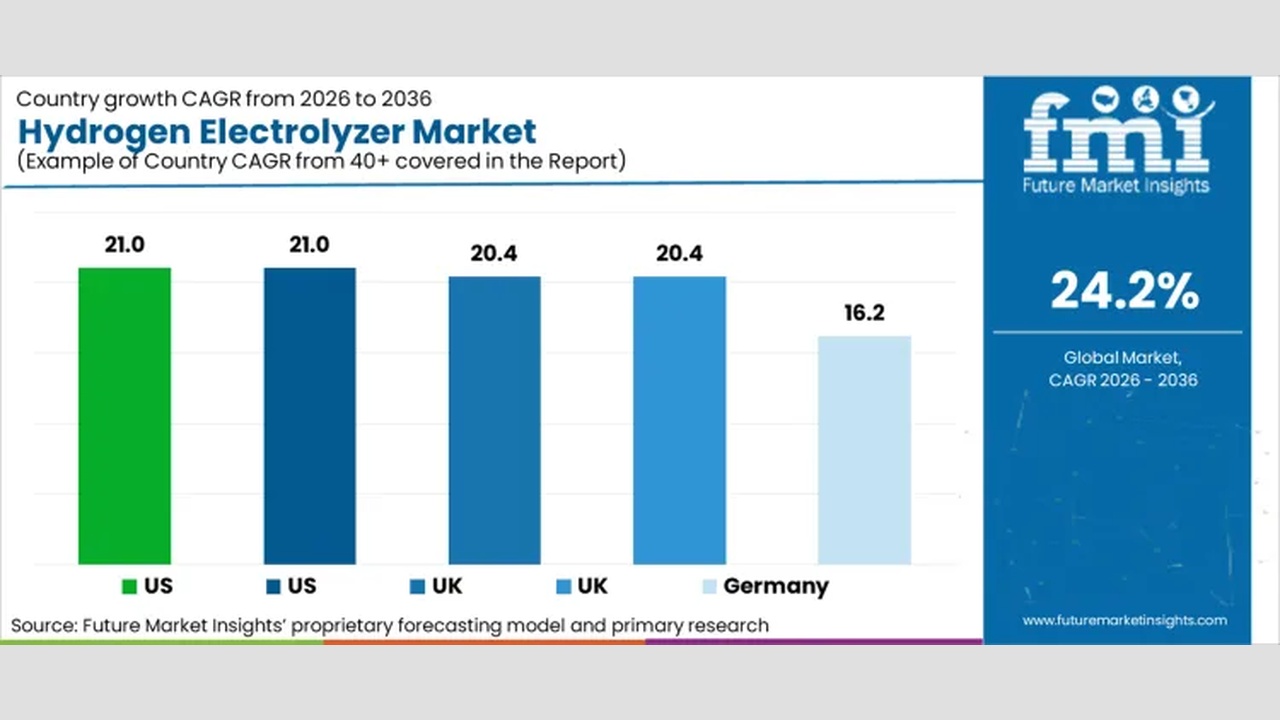
Plug Power Hydrogen 2026, 275 MW Hy 2 gen Deal

PEM Electrolysis Cost Barriers, 275 MW Plug Power-Hy 2 gen Deal, $2000/k W…


Infographic showing electrolysis technology market shares in a donut chart, a blue 'Key growth drivers' box with bullet points, and two bar charts of capacity and installation growth (2023–2027).”,

Versogen Hydrogen 2026, 275 MW Plug Power Deal

AEM Electrolysis Deals: 250 MW In Solare Partnership, 50 MW H 2 Pro Project,…


A five-panel scientific plot showing (a) Degradation (%) vs time (0–25 years) with a sharp vertical marker around year 15, (b) zoomed degradation (%) around 16–16.1 years, (c) Power (kW) vs time with fluctuating values up to ~100 kW, (d) Current density (A/cm2) vs time with rapid fluctuations, and (e) Cell voltage (V) vs time showing step-like drops between ~0 and ~2 V, all framed by a purple border.

Bosch Hydrogen 2026, 20 MW Dynelectro Pilot Project

PEM Electrolysis Durability, Plug Power 275 MW Project, $750 M DOE Fund, and 52…


Stacked area chart showing BOP costs vs. capacity for a water electrolysis plant; costs rise to about 900–1000 (2020$) as capacity is low and decrease as capacity increases, with stack costs forming the lower bands labeled by component colors. X-axis: annual capacity (MW/yr); Y-axis: system manufactured cost (2020$ per kW). Legend lists BOP components and stack components by color.

Supercritical Hydrogen 2026, $18.8M Shell Investment

AEM Electrolysis Scale-Up, Versogen's 250 MW In Solare Factory, Horizon 5 MW…


Industrial control room with large electrical transformers, cooling fans, and yellow safety railings around a platform]} {

Plug Power Hydrogen 2026, 5 MW Namibia Project

Plug Power PEM Electrolysis, 275 MW Hy 2 gen Deal, 100 MW Galp Project, and 3…


Privacy Preference Center