

Bifacial Solar Grid Interconnection Delays, 2, 600 GW in Queues, >50 Month Wait Times, and the Pivot to Distributed Solar (2024 to 2026)
The U.S. utility-scale solar market is contending with a critical infrastructure failure as grid interconnection queues have become the single largest impediment to growth. While the technology’s cost-effectiveness is undisputed, systemic delays and rising costs associated with connecting to an aging grid are stalling financially viable projects, forcing a strategic and necessary pivot toward faster-to-deploy distributed generation. The policy shock from the July 2025 “One Big, Beautiful Bill Act” (OBBBA) has amplified this crisis, making projects stuck in interconnection backlogs unfinanceable and accelerating the shift to a more decentralized energy model.
Grid Interconnection Risk Becomes the Solar Sector’s Primary Execution Barrier
The primary risk to utility-scale solar deployment has shifted from technology cost to infrastructure access, with ballooning grid interconnection queues creating multi-year backlogs that threaten the financial viability of the entire project pipeline.
- Before 2025, the industry focused on scaling production and driving down costs during a period of supportive federal policy. Following the OBBBA’s enactment, which created an abrupt July 2026 “begin construction” deadline for tax credits, the pre-existing issue of gridlock transformed into an existential threat for projects not already in advanced development stages.
- The scale of the problem is immense, with the U.S. grid interconnection queue reaching nearly 2, 600 GW by the end of 2023, dominated by solar and storage projects. This logjam represents a massive pipeline of stalled capacity, dwarfing the nation’s currently installed generation.
- Project timelines have extended dramatically, with the median duration from interconnection request to commercial operation surging from approximately 20 months in 2005 to over 50 months by 2023. This delay makes it nearly impossible for new projects to meet the OBBBA’s stringent deadlines.
- The financial penalty for these delays is severe. Interconnection costs have risen sharply, and the uncertainty makes securing project finance without a firm interconnection agreement exceptionally difficult, directly contributing to project cancellations and eroding investor returns.
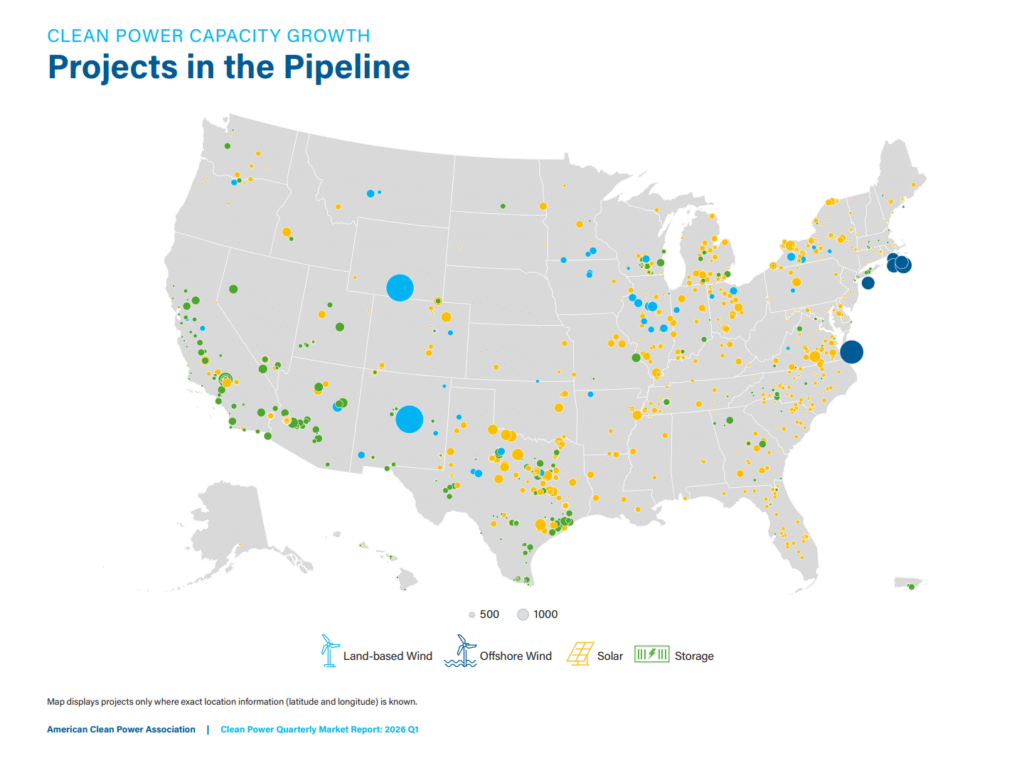
US Clean Energy Project Pipeline Mapped
The map visualizes the geographic concentration of the project pipeline, highlighting the areas most affected by the grid interconnection risk discussed in the section.
(Source: PV Magazine)
$6.9 B in Q 1 2025 Cancellations as Solar Financing Gaps Widen
The convergence of interconnection delays and policy uncertainty has triggered a wave of project cancellations, as the economics of utility-scale solar erode under the pressure of rising costs and uncertain timelines.
- The immediate aftermath of the OBBBA saw a significant spike in cancellations, with six announced projects representing $6.9 billion of investment cancelled in Q 1 2025 alone. This trend continued throughout the year, with a total of 85 large-scale clean energy projects cancelled in 2025 and another 38 in Q 1 2026.
- This financial fallout is a direct result of worsening project economics. The national average Levelized Cost of Energy (LCOE) for utility-scale solar increased from $36/MWh to $41/MWh in 2025. Concurrently, North American solar Power Purchase Agreement (PPA) prices rose 9% year-over-year, making it more expensive for buyers and squeezing developer margins.
- The accelerated phase-out of the Investment Tax Credit (ITC) makes projects stuck in multi-year interconnection queues unfinanceable. Tax equity investors and lenders are unwilling to back projects that cannot guarantee they will meet the 2026 and 2027 deadlines, creating a significant financing gap for a large portion of the development pipeline. The market saw over $22 B in project cancellations as major players like Next Era adjusted their pipelines.

US Solar Installations Stagnate Despite Supply Growth
Stagnating installations are a direct visual consequence of the project cancellations and financing gaps detailed in this section, representing the market slowdown.
(Source: Deloitte)
Table: U.S. Solar Market Contraction and Cancellation Signals (2025-2026)
| Metric | Time Frame | Details and Strategic Impact | Source |
|---|---|---|---|
| Project Cancellations | 2025 | 85 large-scale clean energy projects were cancelled across the U.S., reflecting widespread investor pullback after the OBBBA policy shift. | E 2.org |
| Cancelled Investment Value | Q 1 2025 | $6.9 billion in announced project investment was cancelled, indicating an immediate and severe market reaction to heightened policy and execution risk. | Clean Investment Monitor |
| Installation Decline (Utility-Scale) | Q 2 2025 | Utility-scale installations fell to 5.7 GWdc, a 28% drop year-over-year, as developers delayed or cancelled projects facing the new ITC deadlines. | SEIA |
| Full-Year Installation Decline | 2025 | Total utility-scale installations for the year were 34.7 GWdc, a 16% decrease from the record 41.4 GWdc installed in 2024, marking a sharp reversal of market growth. | PV Magazine USA |

Global Solar Shipments Contract in 2025
This chart provides macroeconomic context for the U.S. market contraction discussed in the accompanying table. A decrease in U.S. demand would contribute to this global trend.
(Source: Enerdata)
U.S. Focus, Solar Developers Pivot as Grid Delays Force Decentralization
While grid congestion is a global challenge, the U.S. market provides the clearest example of how infrastructure bottlenecks, when combined with policy shocks, force a rapid strategic pivot to distributed generation as a viable alternative.
- The U.S. interconnection logjam, with its nearly 2, 600 GW queue and 50+ month wait times, represents the most acute pressure point. The situation is so severe in some regions that the PJM interconnection backlog alone holds up over 200 GW of projects. This is a more extreme version of issues seen elsewhere, such as in the EU, where 120 GW are at risk, or in India, where delays average four to five months.
- The OBBBA acted as a catalyst in the U.S., forcing a market-wide re-evaluation. Large energy consumers like data centers, which cannot tolerate multi-year delays for power, are leading the charge. Big Tech firms are increasingly bypassing the utility-scale development process by investing in on-site and distributed solar and storage to meet their energy needs more quickly and reliably.
- This strategic shift is visible in market growth trends. While the utility-scale segment contracted in 2025, the residential solar segment is projected to be the fastest-growing, with a forecasted CAGR of 18.3% through 2031, signaling a structural rebalancing of the market toward smaller, localized systems.

US Electricity Generation Growth Surges, Led by Texas
This chart identifies a key driver for the ‘U.S. Focus’ and developer pivot, showing surging electricity demand in key states like Texas, which creates opportunities for new solar development.
(Source: Apricitas Economics)
Solar Market Shifts to Distributed Generation Post-OBBBA (2025 to 2026)
The definition of a mature, commercially viable solar strategy has evolved in response to systemic bottlenecks; speed-to-market and risk mitigation now favor distributed assets over stalled utility-scale projects.
- Between 2021 and 2024, market maturity was defined by the ability to develop and finance massive, centralized solar farms to take advantage of economies of scale and supportive federal incentives. This model successfully drove down the LCOE of solar to become the cheapest form of new-build energy.
- From 2025 onward, this model’s viability has been challenged. While utility-scale solar remains cost-competitive on paper (unsubsidized LCOE of $29-$42/MWh), the *realized* cost and time-to-market are now often prohibitive due to interconnection delays.
- In this new environment, Distributed Energy Resources (DERs) represent a more mature commercial solution. These smaller systems can be deployed in months, not years, bypassing transmission-level interconnection queues entirely and delivering power directly at the point of consumption.
- The strategic pivot is not driven by a new technology, but by the commercial reality that a proven, off-the-shelf solution (distributed solar) can circumvent the primary bottleneck (grid access) throttling the growth of large-scale projects from developers like Jinko Solar.

US States Ranked by Community Solar Capacity
This chart directly supports the section’s theme by highlighting ‘community solar,’ a key form of distributed generation. It shows which state markets are most developed in this area that developers are now targeting.
(Source: Energy Changemakers)
SWOT Analysis of Solar Market Amid Gridlock and Policy Risk
The U.S. solar industry’s core strength in cost leadership is being directly challenged by external threats from policy instability and inadequate grid infrastructure, creating a clear opening for distributed generation to capture growth.
- Strengths in low generation cost are being rendered theoretical by an inability to connect to the grid.
- Weaknesses associated with long development timelines have been exposed and amplified by the new ITC deadlines.
- Opportunities are now greatest for business models that can bypass the primary market constraint, such as C&I and community solar.
- Threats from gridlock and policy risk have proven to be concrete and have already triggered a market contraction.

Solar Project Pipeline Shows Significant Future Capacity
This chart illustrates a major ‘Opportunity’ for the solar market. The vast pipeline is a core element to consider in a SWOT analysis, representing potential growth if interconnection challenges are overcome.
(Source: Deloitte)
Table: SWOT Analysis for the U.S. Utility-Scale Solar Sector (2026)
| SWOT Category | 2021 – 2024 | 2025 – 2026 | What Changed / Validated |
|---|---|---|---|
| Strength | Lowest cost of new energy generation, supported by declining panel costs and strong federal incentives (IRA). | LCOE remains low ($29-$42/MWh) but is undermined by rising financing costs and PPA prices. | The theoretical cost advantage is negated if projects cannot reach commercial operation, validating that LCOE alone does not guarantee project viability. |
| Weakness | Long project development cycles and dependence on grid availability were known but manageable risks. | Multi-year development timelines are incompatible with the abrupt 2026/2027 ITC deadlines, making them a critical vulnerability. | The OBBBA policy shock validated that long-duration projects are highly exposed to political risk, a weakness the market is now forced to address. |
| Opportunity | Massive deployment of utility-scale projects to meet corporate and utility decarbonization goals. | Growing demand from data centers and AI is creating a need for rapidly deployable power, favoring DERs that bypass grid queues. | The market opportunity has fragmented; while large-scale demand persists, the execution pathway has shifted toward smaller, faster projects. |
| Threat | Grid interconnection queues were a growing concern but not yet a crisis-level bottleneck for the entire industry. | The 2, 600 GW queue has become the primary barrier to growth, causing widespread project cancellations and financial losses. | The threat of gridlock was fully realized, transforming from a development hurdle into the central factor determining project success or failure. |

Solar Dominates New US Power Capacity in 2025
This chart quantifies a primary ‘Strength’ for the U.S. utility-scale solar sector. Solar’s dominance in new capacity additions is a key positive factor for the SWOT analysis.
(Source: Energy Central)
The 2026 Outlook, Solar Developers Prioritize Safe Harbor and DERs
For the remainder of 2026, the solar market will be defined by a two-track strategy: a frantic race to “safe harbor” viable utility-scale projects before the ITC deadline, coupled with accelerating investment in the distributed generation market as a hedge against execution risk.
- If this happens: A surge of “begin construction” announcements for utility-scale projects before the July 5, 2026, deadline.
Watch this: How many of these projects have firm interconnection agreements versus those taking a gamble. A high percentage of the latter will signal a future wave of project failures or sales at distressed prices. - If this happens: Large developers and investors, unable to move their utility-scale pipelines, will accelerate M&A activity in the C&I and community solar sectors.
Watch this: The acquisition premiums paid for companies with portfolios of smaller, shovel-ready projects. This will confirm the high value placed on bypassing interconnection risk. - If this happens: Utilities will increasingly propose “non-wires alternatives” (NWAs) that utilize DERs in their integrated resource plans.
Watch this: Regulatory approvals for these plans, as they signal a systemic acceptance of distributed resources as a cost-effective alternative to multi-billion-dollar transmission upgrades. - These could be happening: Large module suppliers like Qcells and LONGi Solar may adjust their product mix and sales channels to better serve the rapidly growing distributed generation segment, shifting focus from utility-scale-only customers.