

Occidental Carbon Capture 2026, 450k Tonne JPMorgan Deal
DAC Policy Whiplash: $1.2 B DOE Reversal, 626, 000-Tonne Microsoft Deal, and 2…
Shell Carbon Capture 2026, $7.5B DOE Funding Cuts
DAC Policy Risk: Shell $17 M Avnos Deal, $7.5 B DOE Funding Cuts, and 2 Major…

Occidental Carbon Capture 2026, 3.67M Ton Microsoft Deal
DAC Growth Constraints, $1.2 B Climeworks Hub, 300 k+ Ton Amazon Offtake, &…

Plug Power Hydrogen 2026, $70.2M ITC, Amazon Offtake
Green Hydrogen Financing: Plug Power's $39.2 M ITC Sale, $1.66 B DOE Loan, and…

Deep Sky Carbon Capture 2026, $18B Market, Microsoft Deal
DAC Investment Policy, Canada's 60% CAPEX Credit, 3 Deep Sky Offtake Deals, and…
Carbon Capture 2025, $2.5B DOE Demo Projects, Occidental
Top 10 Carbon Capture Incentives: US DOE's $12.1 B BIL, $180/ton 45 Q credit,…
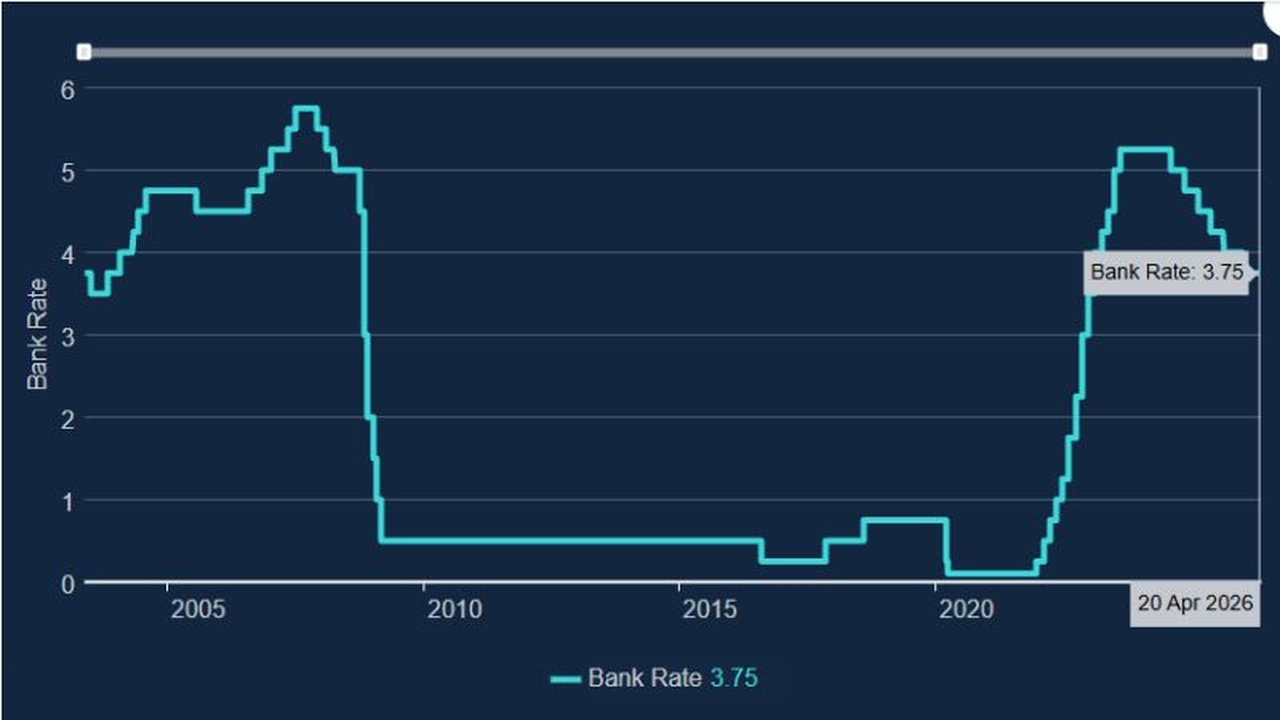
Bank of England Grid & Power Infrastructure 2026, £10B EU CBAM Tax Risk
Bank of England Monetary Policy, 3.75% Rate Hold, 19.5% Gas Surge, and 4%…
Aalborg Portland Carbon Capture 2026, $2.6B Danish Gov Contract
CCUS Industrial Decarbonization, Denmark's $2.6 B Aalborg Portland Subsidy for…
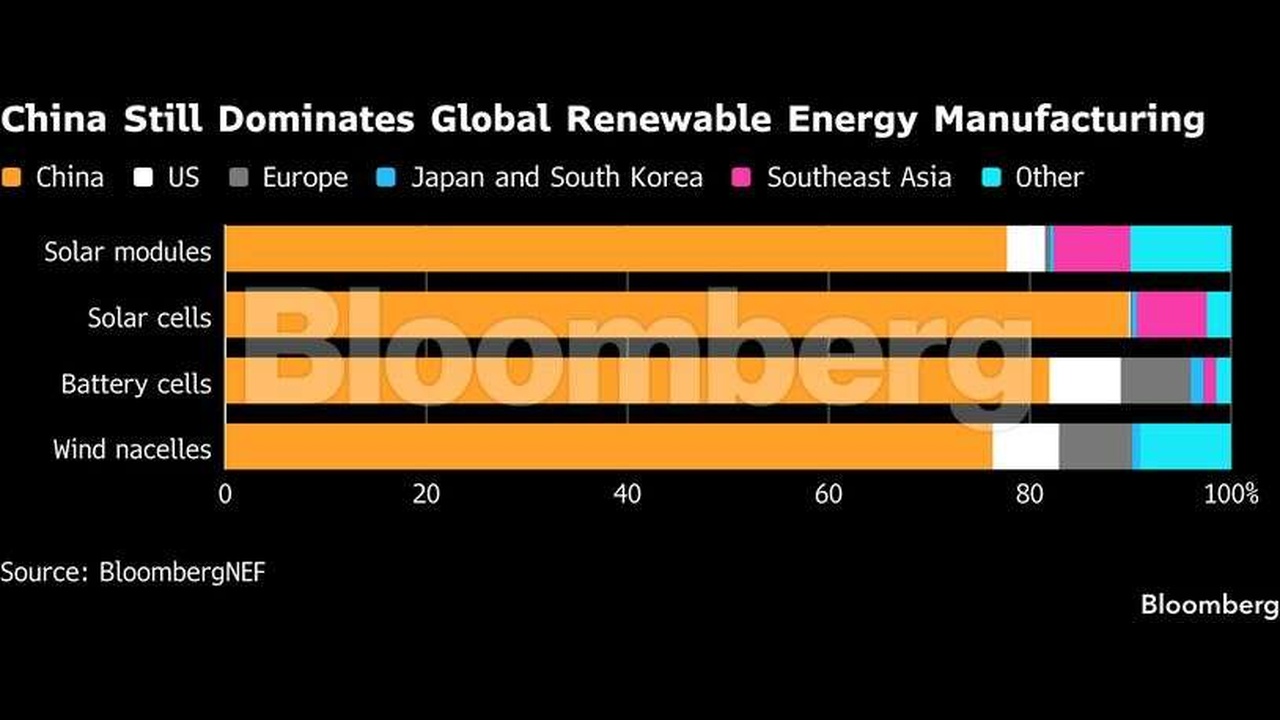
Solar Market 2026, $22B in Cancellations, NextEra Impact
Clean Energy Manufacturing US Policy Risk, $18.6 B in Cancellations, and 21 GW…
Carbon Capture 2026, $41M Frontier Deal, DOE Risk
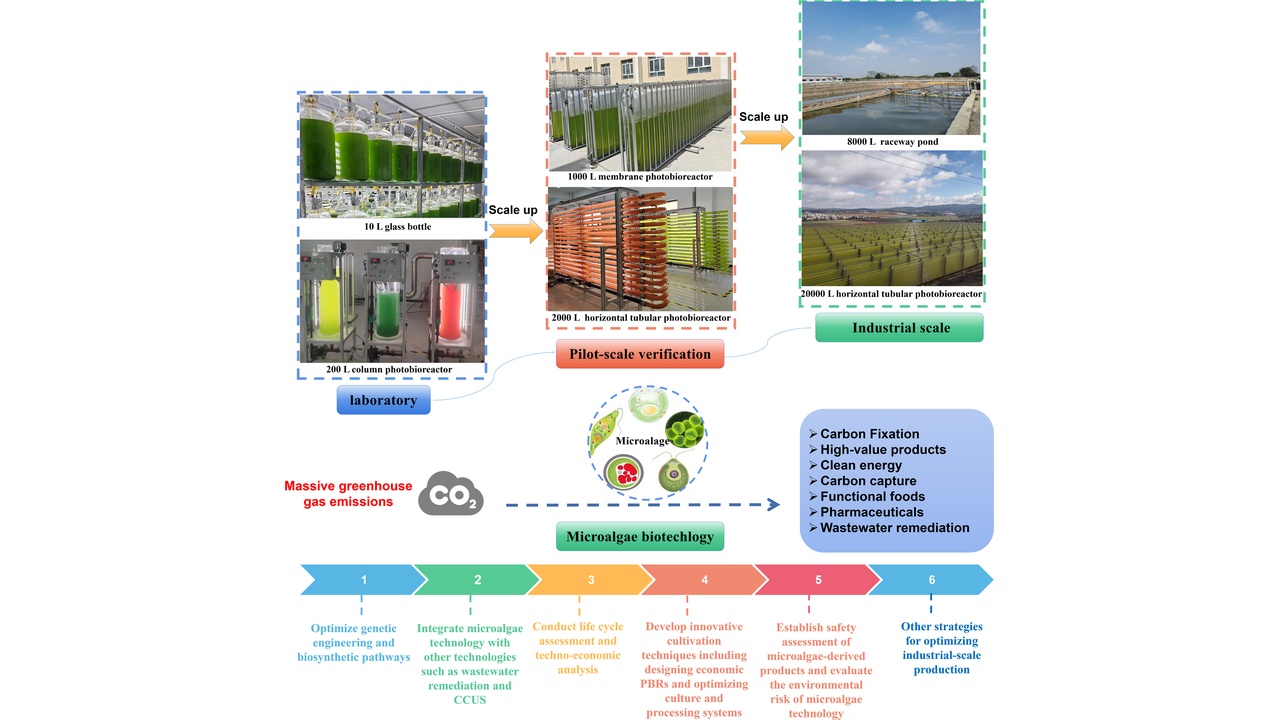
Microalgae DAC Policy Risk, $180/ton 45 Q Credit, $7.5 B in DOE Project…