Bar chart of Hydrogen Electrolyzer Market Revenue Growth (USD Mn) from 2020 to 2035, rising from about 600 in 2020 to 7,595 in 2035, CAGR 25.6% (2025–2035).

Cummins and electrolyzers

Cummins and electrolyzers Cummins' PEM Electrolysis Pivot: $458M Write-Down, bp…


Bar chart of hydrogen electrolyzer market revenue (USD Mn) from 2020 to 2035, rising to 7,595 in 2035 with a 25.6% CAGR (2025–2035).

Siemens Energy and electrolyzers

Siemens Energy and electrolyzers Siemens Energy's PEM Electrolysis Push, 200 MW…


Planar Solid Oxide Fuel Cell Market chart with projected growth to USD 1.74B by 2031 and 9.09% CAGR (2026–2031)

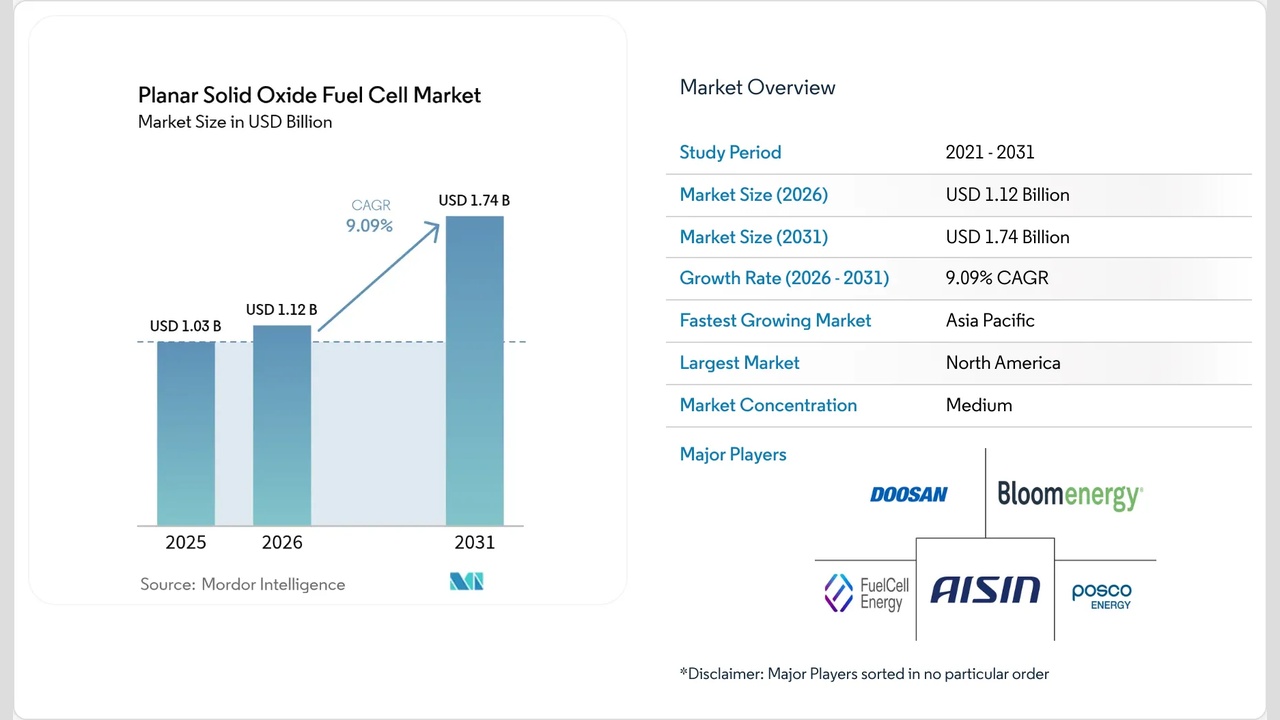
Doosan Fuel Cell 2026: $150M Funding, Shell Consortium

Doosan SOFC Strategy: 50 MW Factory, 9 MW First Order, Ceres Power Pact…


Infographic showing that announced clean hydrogen capacity is much higher than currently operational, by country, with a global capacity bar at bottom.

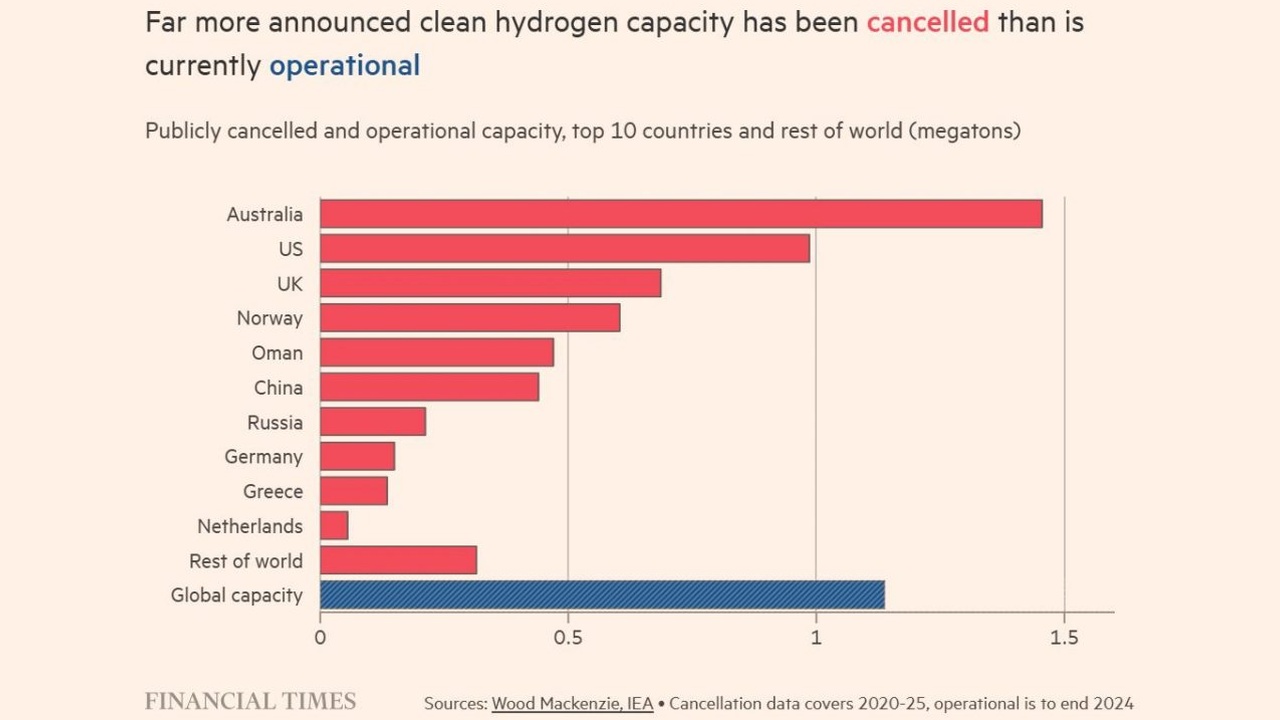
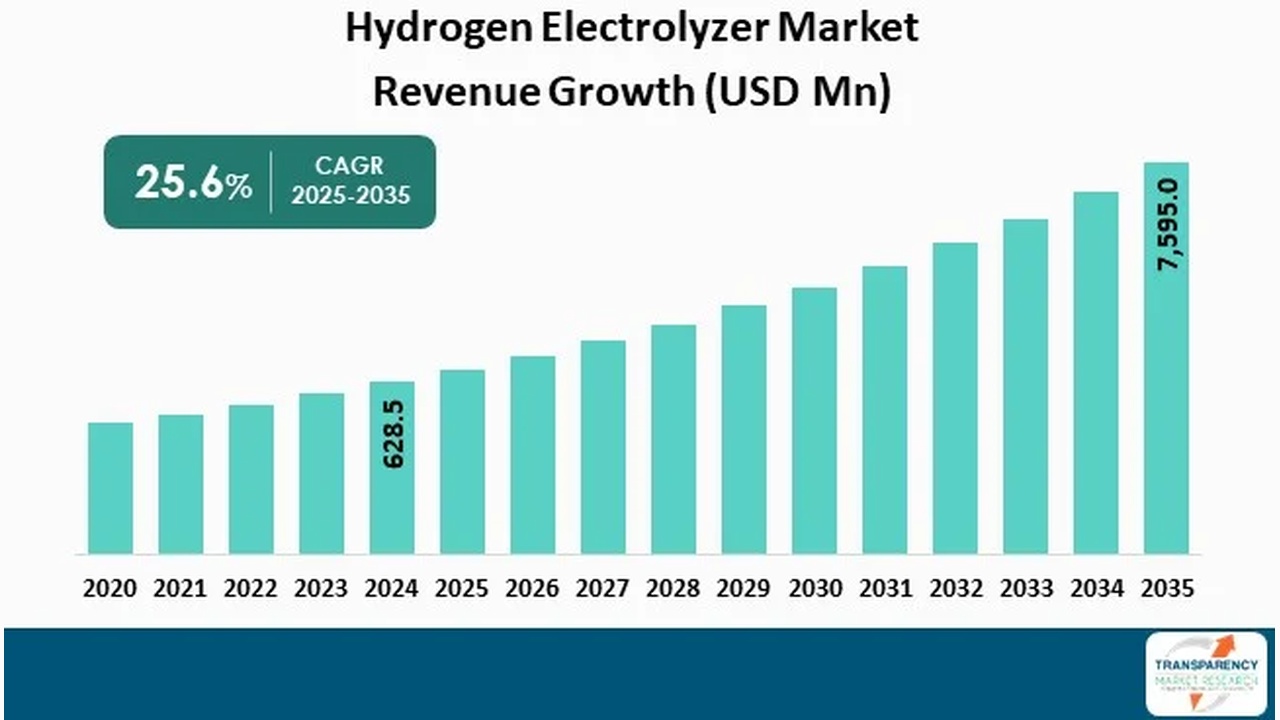
Topsoe Hydrogen 2026, $4B Air Products Project Cancellation

Green Hydrogen Failures: Top 10 Cancellations, Topsoe's 5 GW Deal, and a $1.2 B…


Line chart of HRS capacity vs two metrics: blue line (circles) shows number of HRSs dropping from 140 at 16 capacity to about 82 at 44; red line (squares) shows station utilization decreasing from 100% to about 60%. Left y-axis: number of HRSs; right y-axis: station utilization (%); x-axis: HRS capacity.

Germany Hydrogen 2026, €220 M Fund for Daimler Truck

Green Hydrogen Infrastructure, Germany's €220 M Fund for 400 Trucks, and the…


Infographic showing three aircraft sizes for hydrogen-electric propulsion: large regional turboprop, regional jets, and narrowbody airliner, each with measurement brackets and labels.

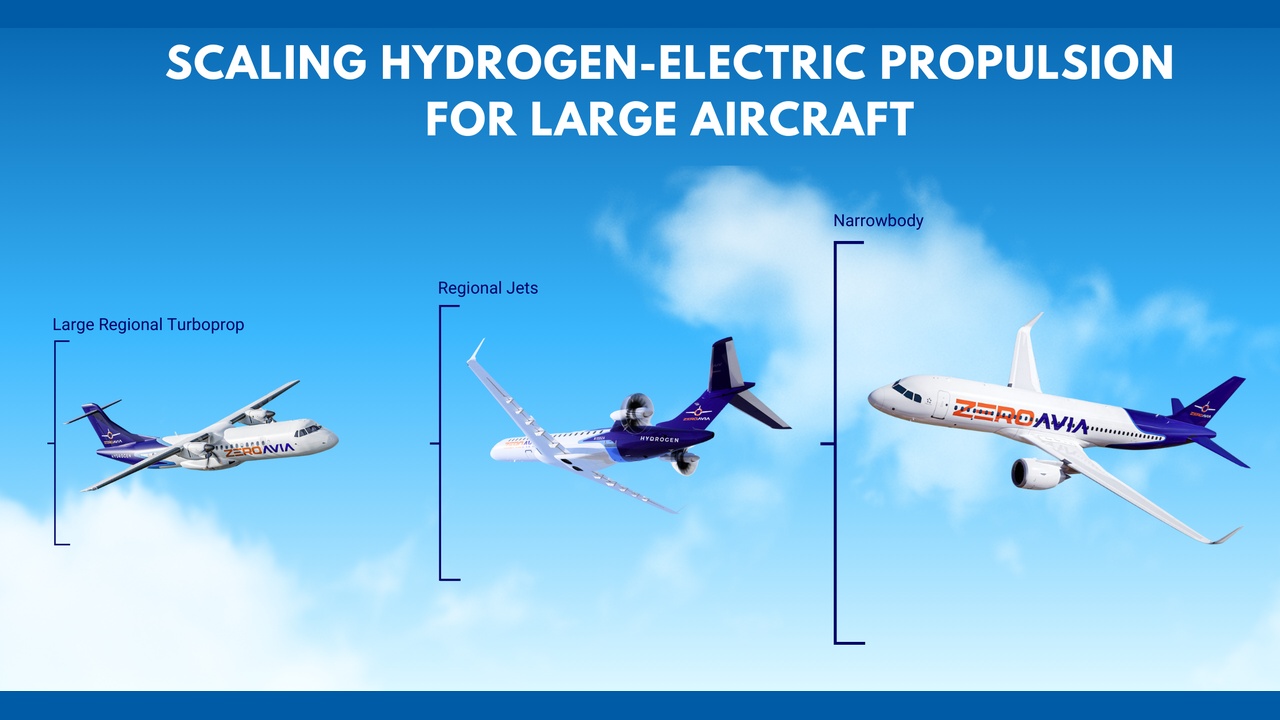
Zero Avia Fuel Cell 2026, $38M Round, KAERI Partnership

PEM Fuel Cell Aircraft, Zero Avia FAA Milestone, $1.1 B Beyond Aero LOIs, and…


Bar chart of Ammonia Crackers Market Forecast (2024–2033) with centralized and decentralized segments.

AFC Energy Hydrogen 2026, 20 MW Balearic Islands Plant

Ammonia Cracking Deployment, AFC Energy $2 M Komatsu Deal, 30 Ton/Day Air…


Overview slide of North America fuel cell market size with a rising bar chart from 2023 to 2033; includes historical data up to 2026, base year 2027, and forecast to 2033. Annotations show USD 1.79 billion and USD 3.47 billion as key values. CAGR 8.64% (2025–2033) is listed.

Plug Power Fuel Cell 2026, 100 MW Galp Project

Plug Power PEM Fuel Cell Strategy, $132.5 M Asset Sale, 275 MW Hy 2 gen Deal,…


Infographic of the Coradia iLint hydrogen fuel-cell train with labeled propulsion components and system overview.

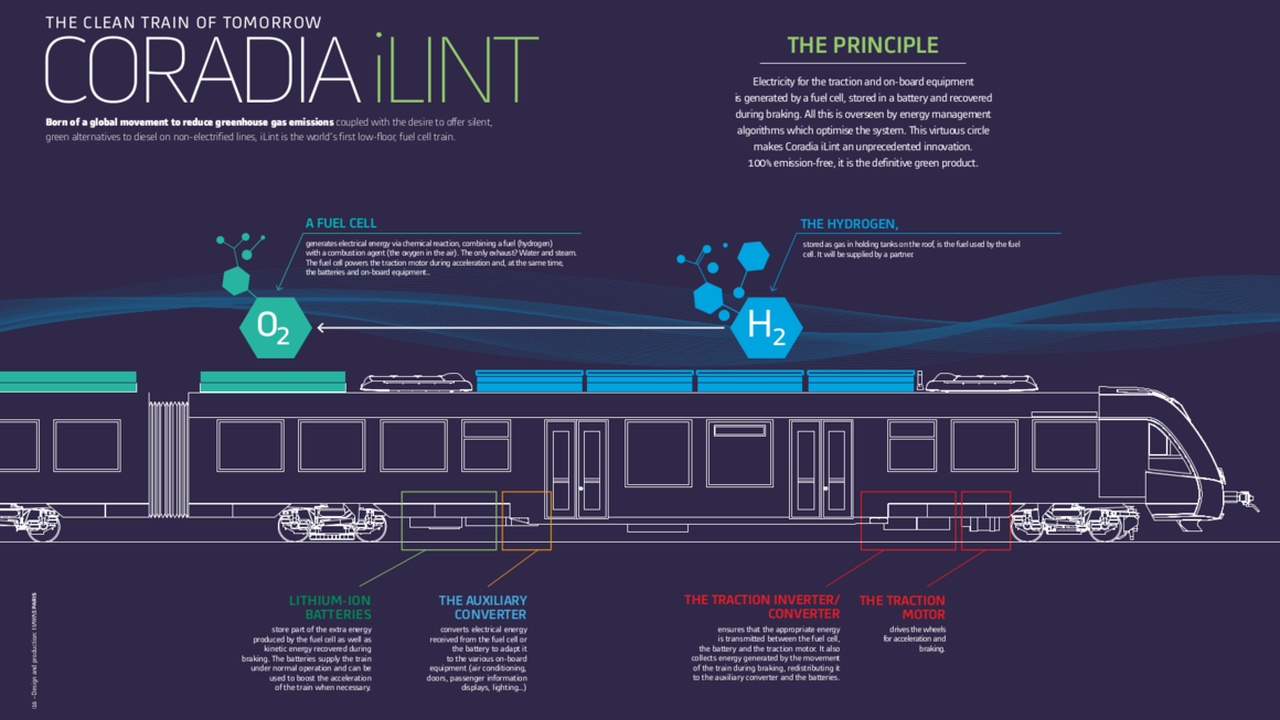
Alstom Hydrogen 2026, $335M Indian Railways Plan

Hydrogen Locomotives 2026, 12 Siemens Train Orders, ₹470 M Concord Deal, and 8…


Bar chart of hydrogen buses market forecast 2025–2033, values from $10B to $43B with 20% CAGR (MRA). Use for trend overview.

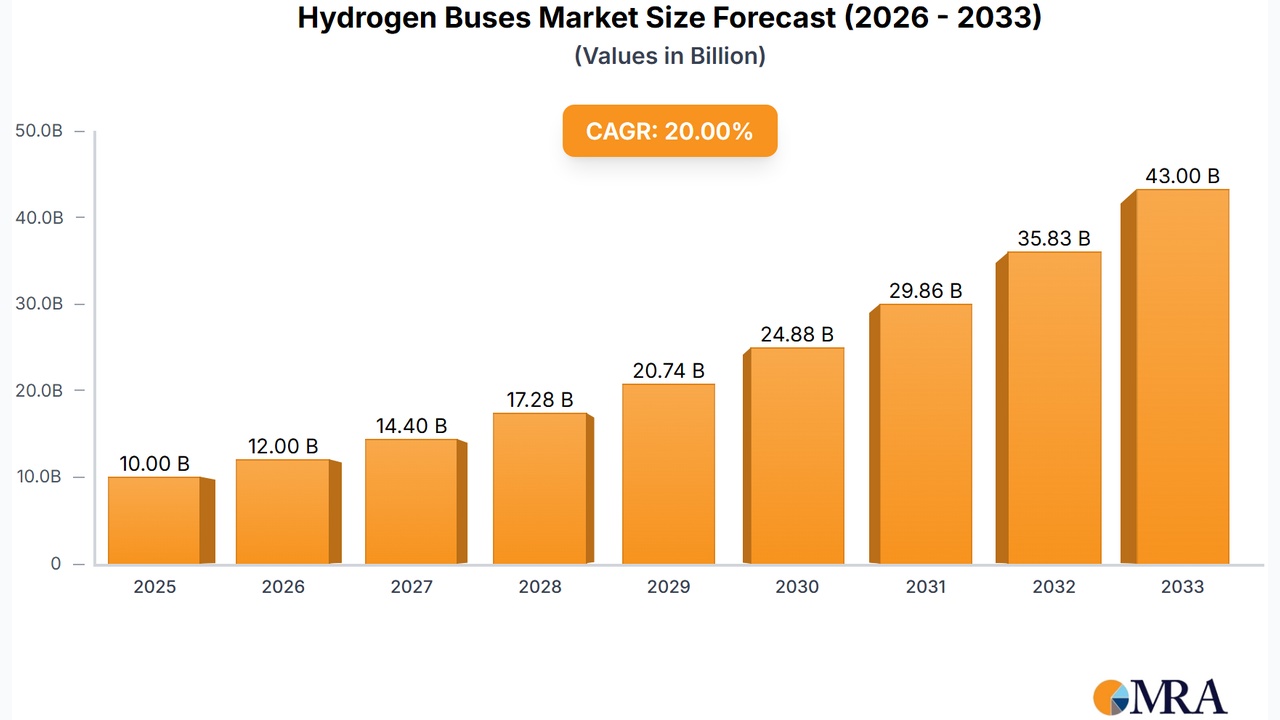
Ballard Fuel Cell 2026, 50 MW New Flyer Agreement

Hydrogen Bus Fleets 2026: 127 Bologna Buses, 500 Ballard Modules, and 14…


Privacy Preference Center