Infographic showing projected data center electricity generation by fuel type (coal, natural gas, nuclear, renewables, other) for Global, China, and the U.S. in 2025 and 2035, with a title about AI-driven energy demand.

Microsoft Carbon Capture 2026, $4.75B Alphabet Deal

AI Power Grid Constraints: Microsoft's 2 GW Pullback, $22 B in Canceled…


Data center corridor with tall server racks on both sides, colorful cables, and technicians visible in the distance.

Iberdrola AI & Data Center Energy 2026, $2.3B Echelon JV

Iberdrola AI Infrastructure Strategy, $2.3 B Echelon JV, €58 B Plan, and 150+…


Infographic chart showing U.S. data center capacity rising from 2020 to 2030, with actual capacity (blue) and projected capacity (cyan dashed) and a 2026 marker.

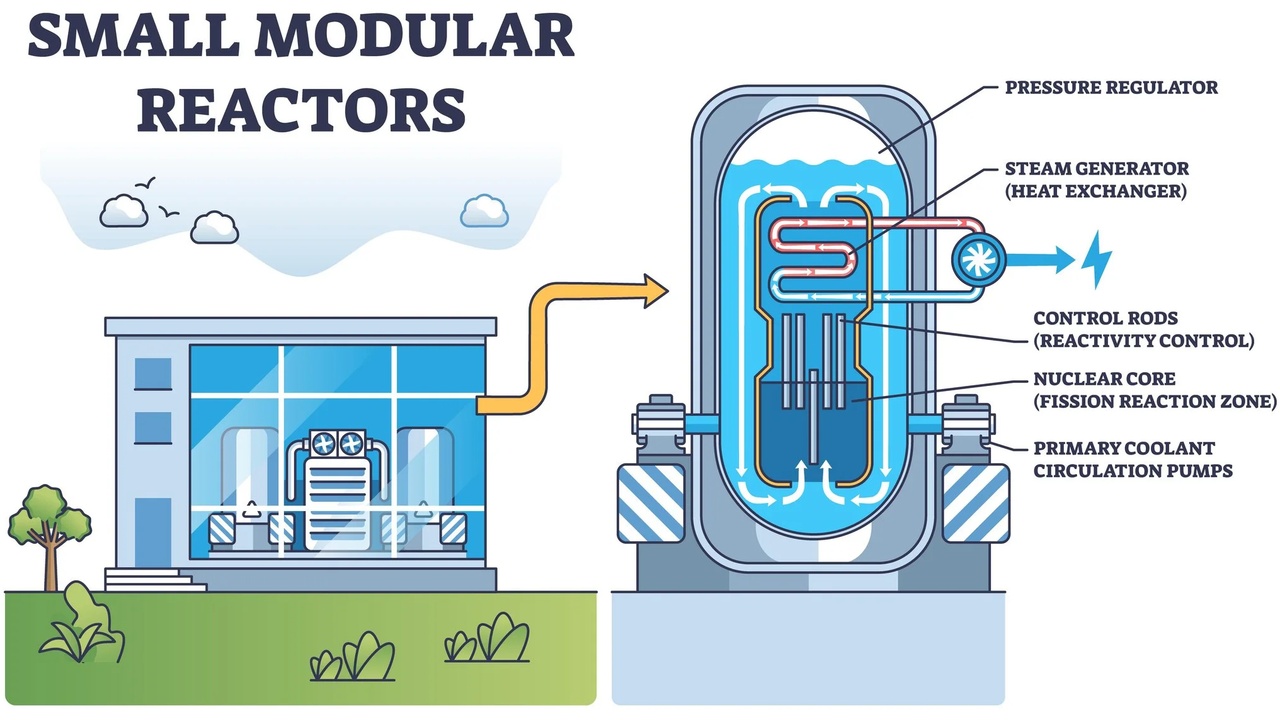
Microsoft Nuclear 2025, $900M DOE Fund for SMRs

SMR Data Center Strategy, Switch's 13 MW Ormat PPA, Google's 150 MW Deal, and…


Infographic of Romania's energy grid: cloud data demand on the left, digital grid lines, an hourglass, and renewable and baseload sources on the right with a reliability goal box.

Data 4 Nuclear 2026, 837 MW Microsoft Deal

Data 4 SMR Strategy, 1.92 GW AWS Deal, 34 Last Energy Units, and 5 Hyperscaler…


Bar chart of 2025 investment in clean energy tech; Solar PV leads by far, followed by wind, storage, biomass, geothermal, electrolyzer, and CCUS.

Fervo Energy Geothermal 2026, 10.5 GW Microsoft Deal

Enhanced Geothermal Drilling, Fervo Energy gets $44 million DOE support for…


Line chart comparing 1-year indexed performance of IGV, SPY, and VIS ETFs with a Claude Sonnet 4.5 release marker

X-energy Nuclear 2026, $650M Terra Power Funding

X-energy SMR Funding for Data Centers, $1.4 B Raised, $500 M Amazon Investment,…


Bar chart by sector showing 2026 net percentages of expected project value changes (higher vs lower). Green bars indicate positive growth (Data Center 57% highest; Power 34%; Other Healthcare 24%; Hospital 20%; Water/Sewer 16%; Manufacturing 15%; Transportation 11%; Bridge/Highway 10%; Warehouse 5%; Federal 5%; Multifamily Residential 4%; Public Building 1%). Red bars indicate negative growth (K-12 School -1%; Higher Education -5%; Lodging -7%; Private Office -14%; Retail -18%). Rightmost column shows 2025 net changes (green up to 15%, red down to -17%). AGC logo appears on the top right.

Microsoft On-site Power 2026, $100B Azure Expansion

Top 10 Data Center Developers: Tract & Meta's 2 GW Plans and Crusoe's Flared…


Table of yearly data center electricity use (TWh) and share of US total demand from 2023 to 2030; 2023: 147 TWh, 3.7%; 2030: 606 TWh, 11.7% (increasing trend).

Amazon Nuclear 2024, $650M Talen Energy Deal

SMR Data Center Projects, 960 MW Amazon Deal, 835 MW Microsoft PPA, and 6 Key…


Diagram of a small modular reactor system: a building connected to a labeled cross-section of the reactor with core, control rods, and pumps (informational)

Microsoft Nuclear 2026, 1,920 MW Amazon PPA

Advanced Reactor PPA Model, 837 MW Microsoft Constellation Deal, 6 GW Meta…


Line chart of projected electricity demand (TWh) from 2010 to 2030 for Hyperscale, Colocation (Retail), and Colocation (Wholesale); wholesale and retail rise steadily, hyperscale increases sharply after 2020.

Google AI & Data Center Energy 2026, 1 GW TotalEnergies

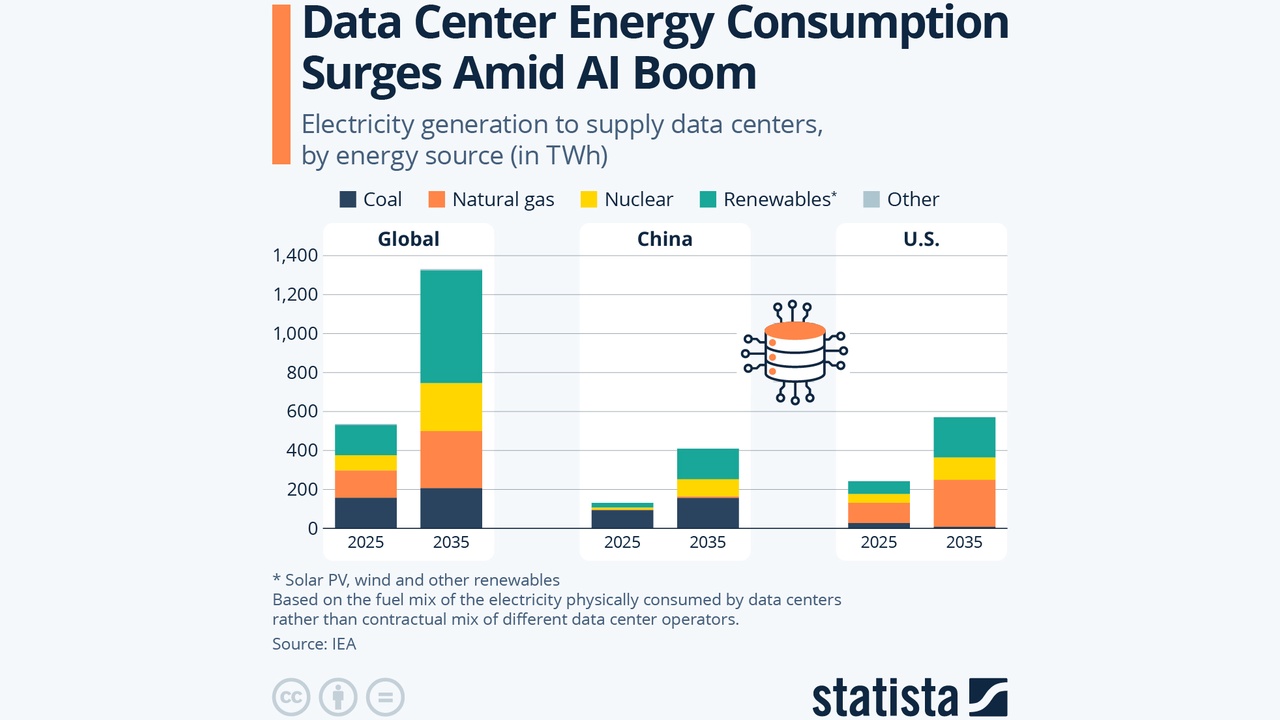
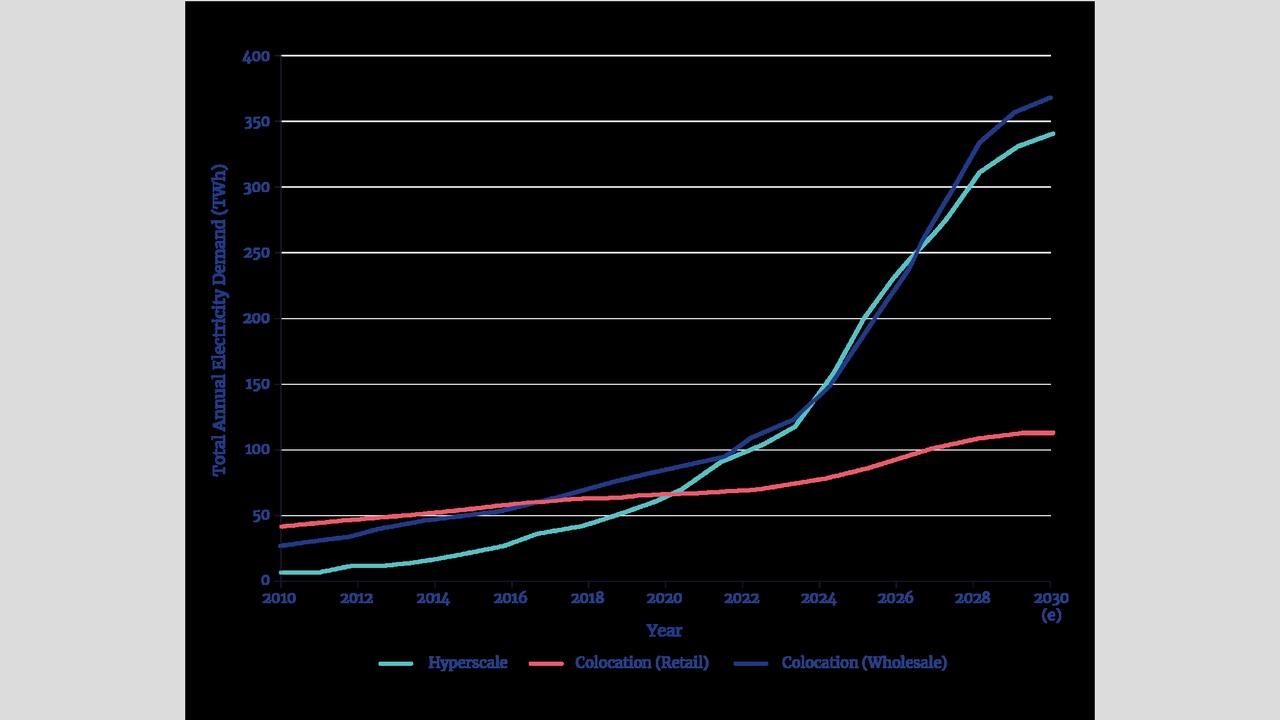
Data Center Grid Constraints, 1, 000 TWh Demand by 2026, 40% Operational…


Privacy Preference Center