Trending News
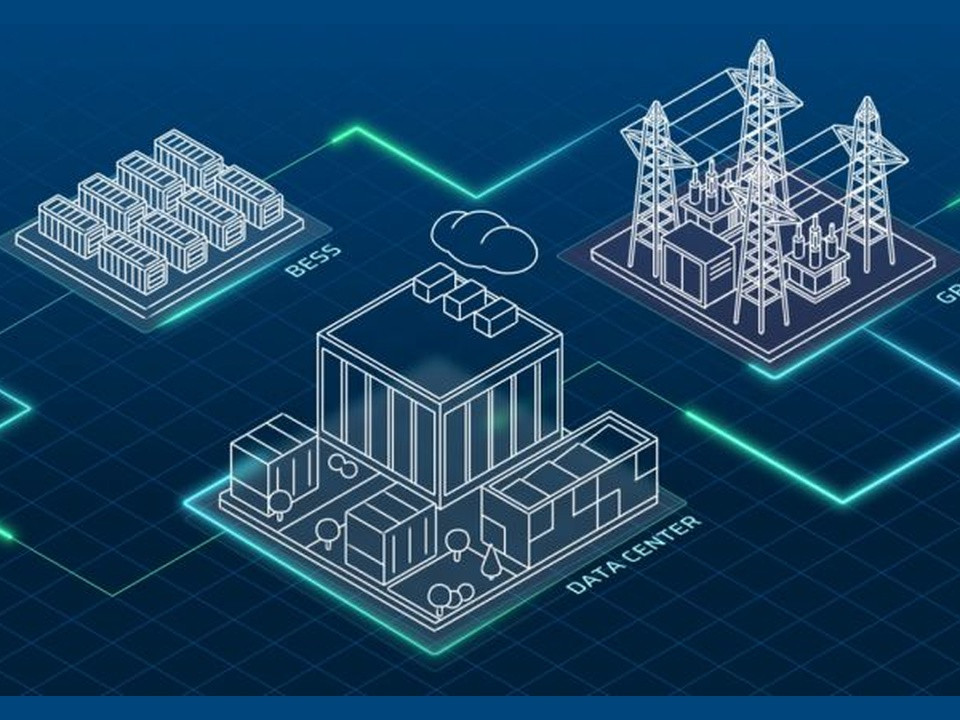
AI & Data Infrastructure


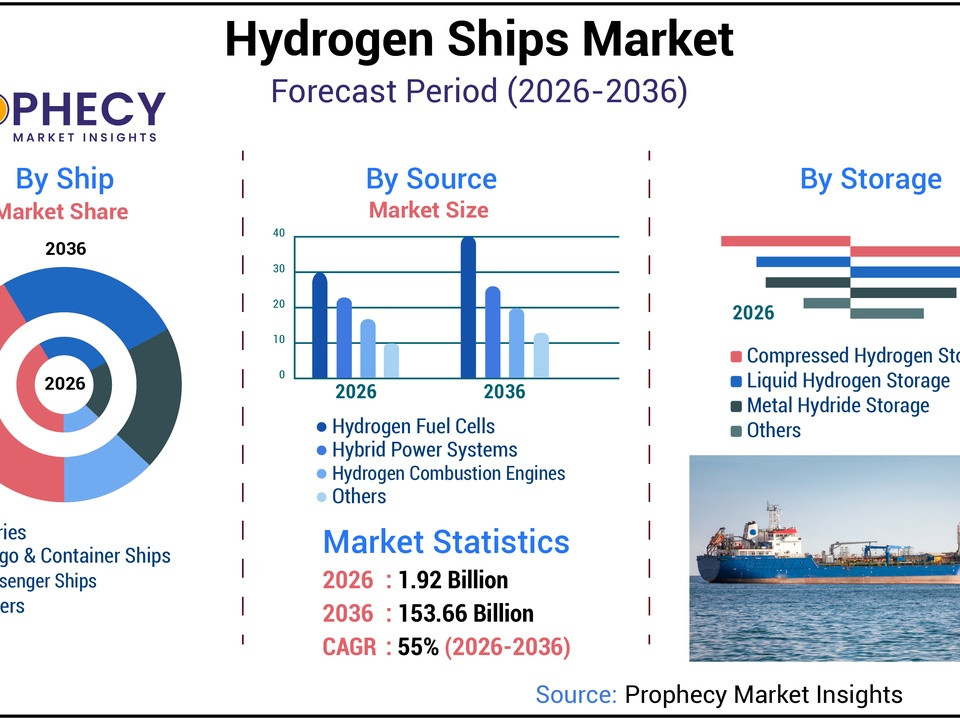
Hydrogen & Fuel Cells


Solar & Distributed Energy


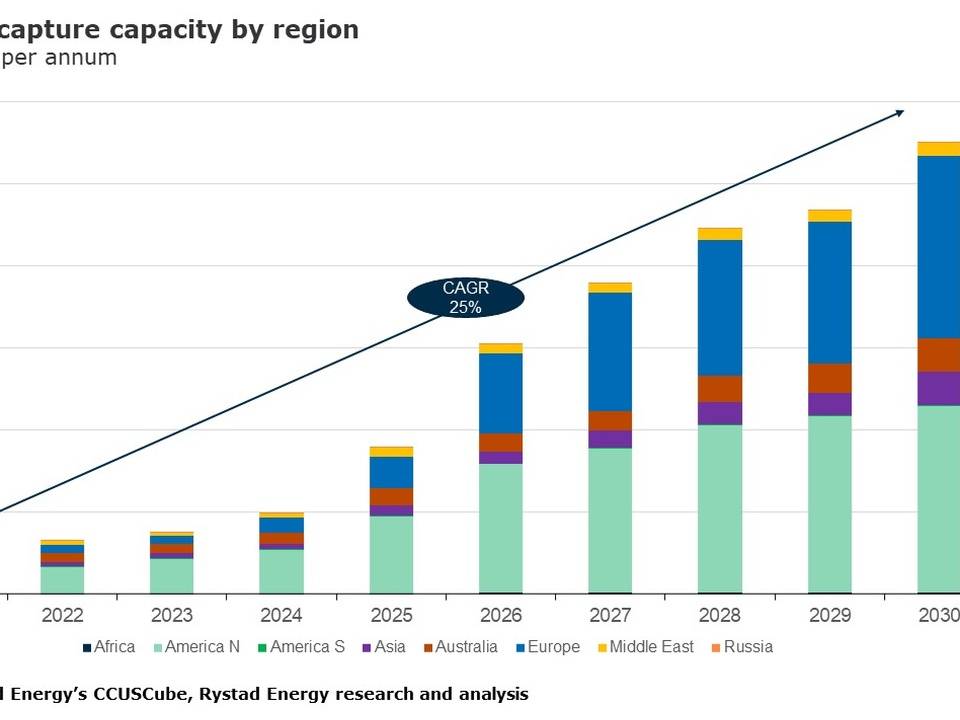
Carbon Capture


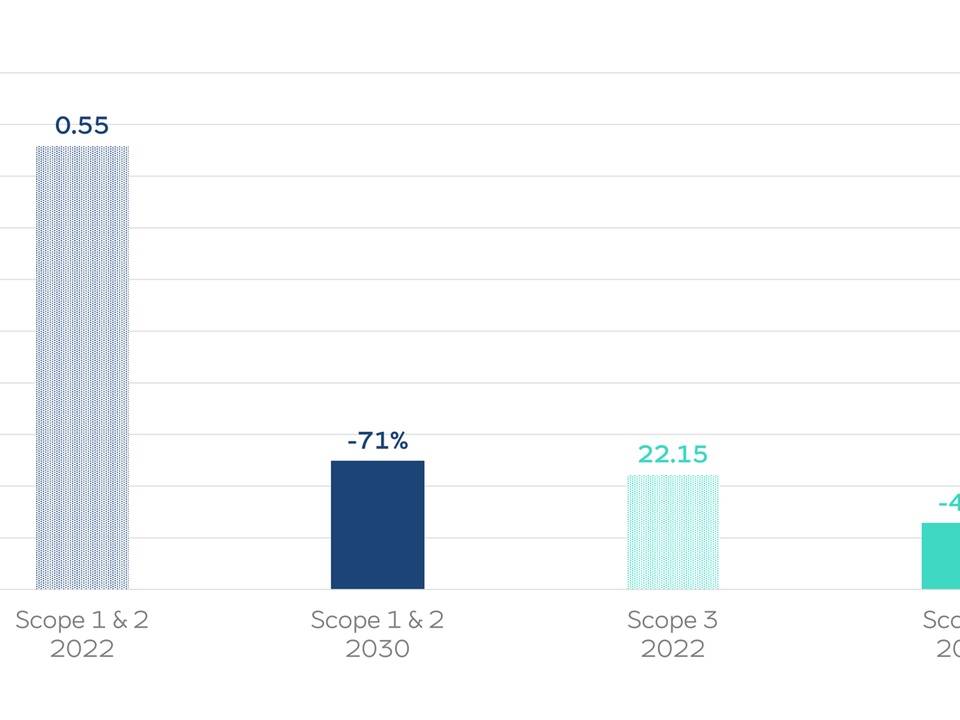
Sustainability


Wind Energy


Critical Minerals


Battery Storage


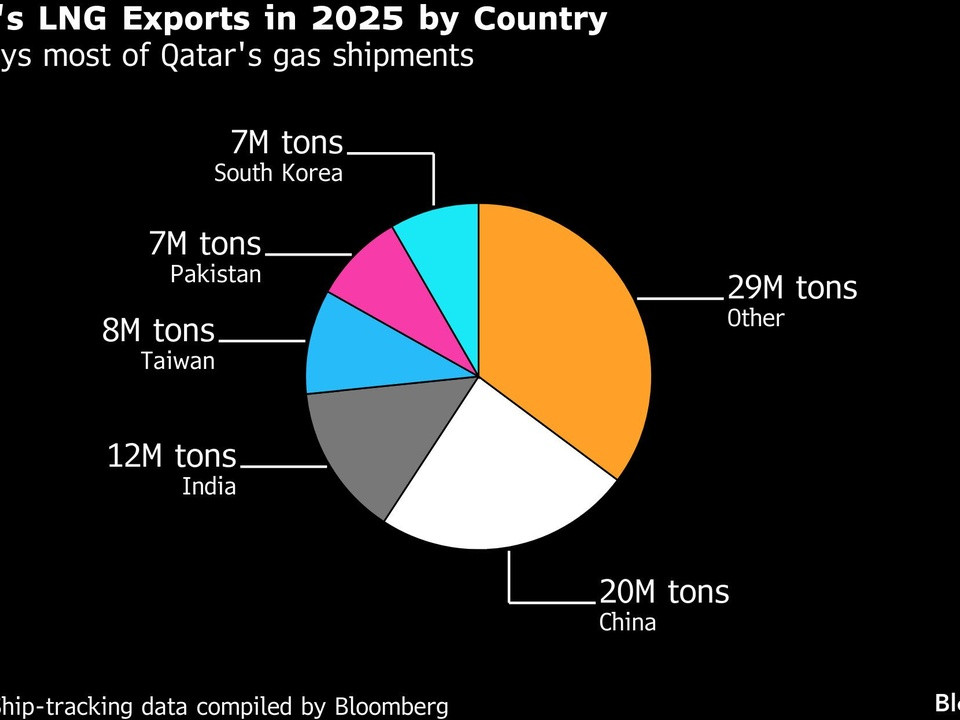
Liquified Natural Gas


Geothermal


Policy & Regulations


SAF
Nothing found.

Nothing found.